Do Learning Styles Work? A 2008 Review Found Few Fair Tests
Myth review Feedback & Forgetting Published
Short answer. The learning-styles claim is that teaching matched to a student's preferred style, such as visual or auditory, improves learning. According to its abstract, a 2008 review by Harold Pashler and colleagues found very few studies built to test that matching claim, and several of those contradicted it. The tests this page could read point the same way: a 2018 review that pooled 11 experiments from 10 suitable studies reported matching effects near zero, though too imprecise to settle the question, and a 2020 study of fifth graders found no significant benefit. People do state preferences; whether teaching to them helps is a different claim.
In one sentence: In a survey published in 2012, 93% of 137 UK and 96% of 105 Dutch teachers interested in brain research agreed that people learn better in their preferred style, yet a 2008 review's abstract reports very few studies built to test that claim.
Myth checked: Individuals learn better when they receive information in their preferred learning style (e.g., auditory, visual, kinesthetic). [status not assigned] Matching visual or auditory teaching to a stated preference; children and adults; tests given after the teaching. Based on a 2008 review's abstract and the full texts of a 2018 pooled analysis and a 2020 experiment; the pooled intervals are too wide, and no bias correction was found, to call the claim not supported. Checked 2026-11-06.
Outline5 sections
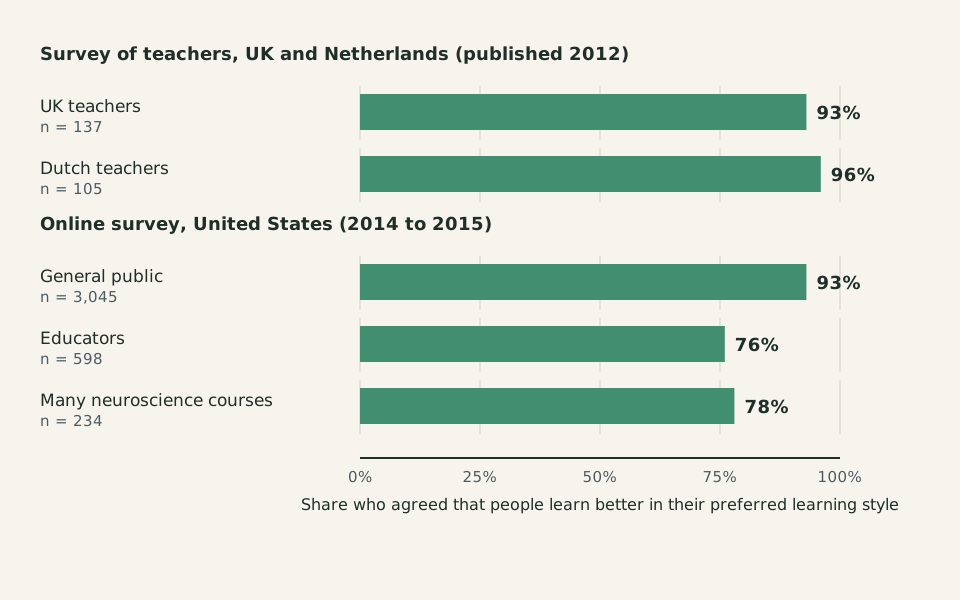
Diagram: Feedback & Forgetting, CC BY 4.0
Copy the credit line
"Who agreed with the learning-styles statement" by Feedback & Forgetting, https://feedbackandforgetting.com/learning-memory/learning-styles/, licensed under CC BY 4.0, https://creativecommons.org/licenses/by/4.0/Data: Dekker, S., Lee, N. C., Howard-Jones, P., & Jolles, J. (2012). Neuromyths in education: Prevalence and predictors of misconceptions among teachers. Frontiers in Psychology 3: 429, doi:10.3389/fpsyg.2012.00429, Table 1, Creative Commons Attribution License (version not stated); Macdonald, K., Germine, L., Anderson, A., Christodoulou, J., & McGrath, L. M. (2017). Dispelling the myth: Training in education or neuroscience decreases but does not eliminate beliefs in neuromyths. Frontiers in Psychology 8: 1314, doi:10.3389/fpsyg.2017.01314, Table 5, CC BY 4.0 (https://creativecommons.org/licenses/by/4.0/)
Share of each group that agreed with the learning-styles statement in two surveys: teachers in the UK and the Netherlands, published in 2012, and an online sample in the United States in 2014 and 2015.
In a survey published in 2012, 93% of UK teachers agreed that people learn better in their preferred learning style. Among the Dutch teachers in the same study, the figure was 96%. Sanne Dekker, Nikki Lee, Paul Howard-Jones and Jelle Jolles put that statement to 242 teachers who were interested in the brain science of learning.
So many believers raise a narrower question. This page asks what researchers found when they ran the experiment that could show matching works.
Replication scorecard
| Claim | Popular source (read as) | Tested by (read as) | Summarized by (read as) | Status |
|---|---|---|---|---|
| Individuals learn better when they receive information in their preferred learning style (e.g., auditory, visual, kinesthetic) | A survey statement that 93% of UK and 96% of Dutch teachers agreed with in Dekker et al. 2012; no dated textbook or press source was read (full text) | Aslaksen & Lorås 2018, a review that pooled 11 experiments from the 10 studies it found; Rogowsky, Calhoun & Tallal 2020, fifth graders (full text) | Pashler, McDaniel, Rohrer & Bjork 2008 review (abstract) | [status not assigned] Matching teaching to a visual or auditory preference, tests given after instruction. Pooled effects were close to zero and slightly negative, but their wide intervals and the lack of a bias correction leave the status open; the one test in children found no significant matching benefit; checked 2026-11-06 |
| Children and adults will say how they prefer to receive information | A survey statement on preferences that more than 80% of teachers in Dekker et al. 2012 marked correct (full text) | Rogowsky, Calhoun & Tallal 2020: 68% of fifth graders had no clear auditory or visual preference on the inventory used (full text) | Pashler, McDaniel, Rohrer & Bjork 2008 review, which reports ample evidence that people state preferences (abstract) | [status not assigned] Stated preferences, not learning gains; in one school's fifth grade, 68% of students had no clear preference between the two; checked 2026-11-06 |
How widely it is believed
That survey gave teachers 32 statements about the brain and learning, 15 of them myths, in random order. Teachers marked each one correct, incorrect or do not know. Only 4% of the UK teachers and 3% of the Dutch teachers rejected the learning-styles statement. Learning styles had also turned up in the schools of 98% of the UK teachers and 64% of the Dutch ones.
Kelly Macdonald and colleagues used the same statement, with true or false answers, in an online survey of people in the United States from August 2014 to April 2015. It was the most widely endorsed myth in the survey: 93% of 3,045 members of the public, 76% of 598 educators and 78% of 234 people who had taken many neuroscience courses called it true.
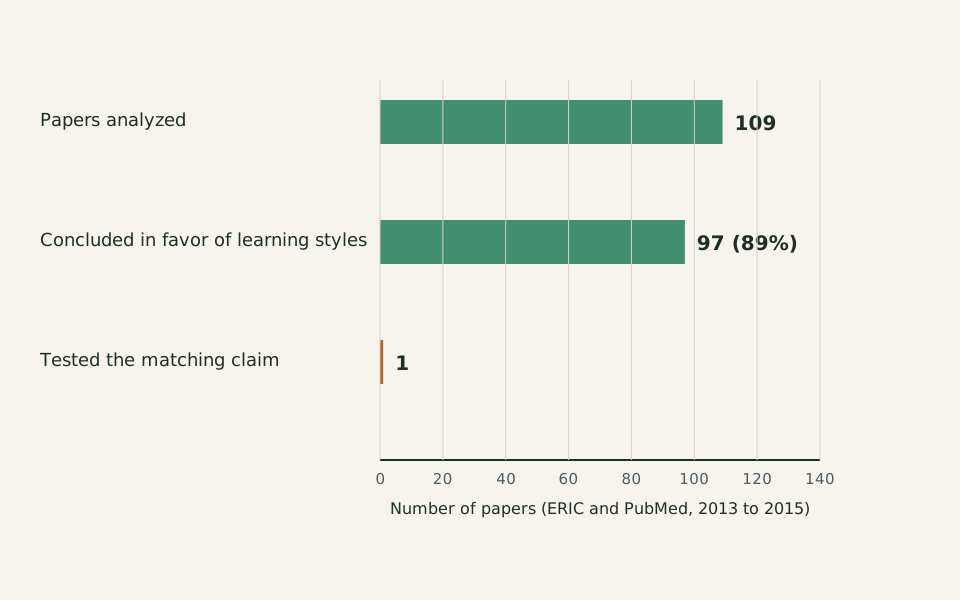
Diagram: Feedback & Forgetting, CC BY 4.0
Copy the credit line
"Recent papers on learning styles" by Feedback & Forgetting, https://feedbackandforgetting.com/learning-memory/learning-styles/, licensed under CC BY 4.0, https://creativecommons.org/licenses/by/4.0/Data: Newton, P. M. (2015). The learning styles myth is thriving in higher education. Frontiers in Psychology 6: 1908, doi:10.3389/fpsyg.2015.01908, Table 1, CC BY 4.0 (https://creativecommons.org/licenses/by/4.0/)
Papers on learning styles in higher education found in two research databases for 2013 to 2015, as counted by Philip Newton in 2015.
The idea also fills research papers. Philip Newton searched two databases, ERIC and PubMed, for recent papers on learning styles in higher education, published from 2013 to 2015. Of the 109 he analyzed, 97 (89%) concluded in favor of using learning styles, and 1 tested the matching claim. Newton judged the papers alone and names that as a limitation.
This page did not read a textbook, course handout or newspaper article that states the claim. The surveys and Newton's count are its evidence that the idea is widespread. Two papers read here in full, a 2018 review by Karoline Aslaksen and Håvard Lorås and a 2020 study by Beth Rogowsky and colleagues, report that teacher-education textbooks still present learning styles; both cite books this page did not read.
What a fair test looks like
The 2008 review by Harold Pashler, Mark McDaniel, Doug Rohrer and Robert Bjork spells out, in its abstract, what a convincing test needs. First, sort learners by their learning style. Then assign people in each group at random to different kinds of teaching, and give everyone the same final test.
The result has to show a crossover, which researchers call an interaction. The method that works best for visual learners must not be the one that works best for auditory learners. The review calls the idea being tested the meshing hypothesis: teaching should mesh with the learner's preferred format.
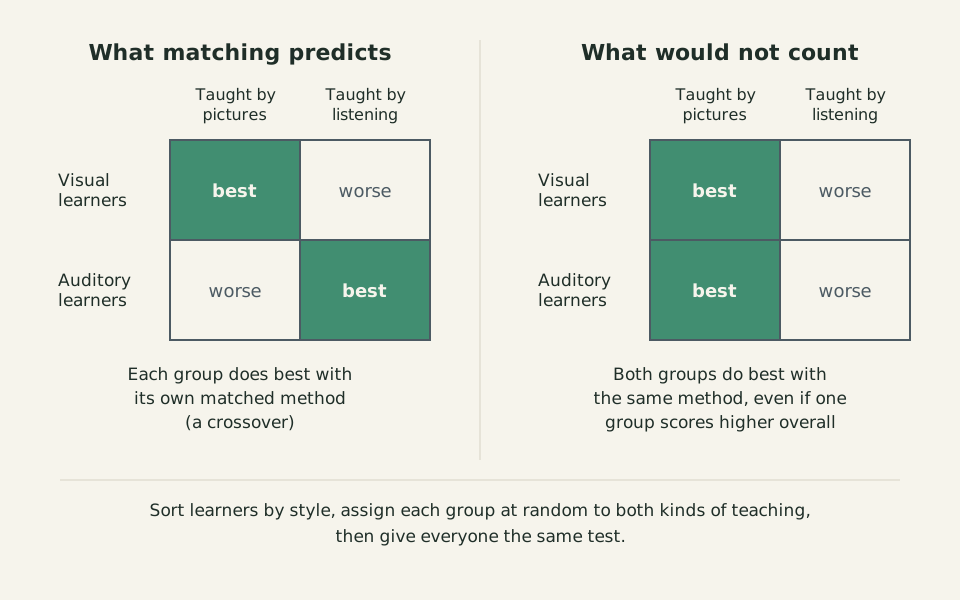
Diagram: Feedback & Forgetting, CC BY 4.0
Copy the credit line
"What a fair test of matching has to show" by Feedback & Forgetting, https://feedbackandforgetting.com/learning-memory/learning-styles/, licensed under CC BY 4.0, https://creativecommons.org/licenses/by/4.0/Two possible results of the same design. Only the crossover on the left would support matching; the grids show the pattern, not data from any study.
A common kind of result does not pass this test. If visual learners score higher whether they read or listen, that is a difference between people, not a benefit of matching. Matching predicts that the ranking of methods flips from one group to the other.
Few studies were built this way. In the review's words, “very few studies have even used an experimental methodology capable of testing the validity of learning styles applied to education” (p. 105). The abstract adds that many versions of learning styles have never been tested at all, so their status is unknown rather than disproved.
What the proper tests found
The 2008 review, as its abstract reports, found almost no evidence of the crossover. Of the few studies with a suitable design, several produced results that directly contradicted matching. The abstract gives no counts or effect sizes, so this page cannot judge how strong those tests were.
[status not assigned] Studies of learning styles reviewed up to 2008. Based on the abstract, which gives no numbers. Checked 2026-11-06.
Eleven experiments, pooled
Aslaksen and Lorås searched the literature up to January 2018 and screened 1,215 records. They found 10 studies whose design they judged suitable under Pashler's criteria; those studies held 13 experiments, and 11 gave enough data to pool 22 effect sizes. The effect size here, Hedges' g, is the gap between matched and mismatched groups in standard-deviation units. Matching to a visual style gave g = −0.09 (95% CI −0.74 to 0.58; 484 participants), and matching to an auditory style gave g = −0.27 (95% CI −0.87 to 0.32; 356 participants).
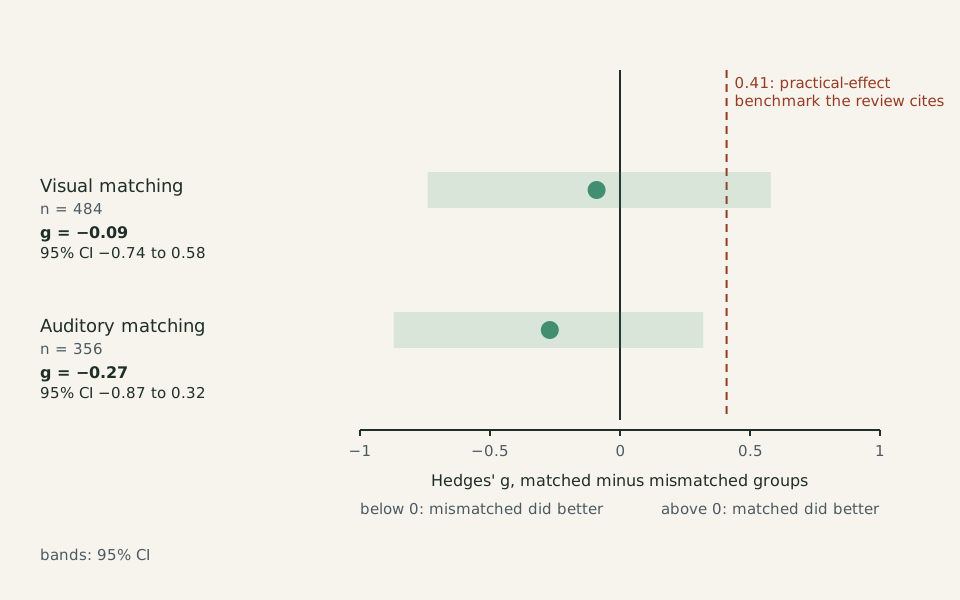
Diagram: Feedback & Forgetting, CC BY 4.0
Copy the credit line
"Pooled effect of matching teaching to a learning style" by Feedback & Forgetting, https://feedbackandforgetting.com/learning-memory/learning-styles/, licensed under CC BY 4.0, https://creativecommons.org/licenses/by/4.0/Data: Aslaksen, K., & Lorås, H. (2018). The modality-specific learning style hypothesis: A mini-review. Frontiers in Psychology 9: 1538, doi:10.3389/fpsyg.2018.01538, section Tailoring Instruction for Modality-Specific Preferences, paragraphs 1 and 2, CC BY 4.0 (https://creativecommons.org/licenses/by/4.0/)
Pooled effect of matching, with 95% confidence intervals, from the 2018 analysis. Values below zero mean the mismatched groups did slightly better.
Both estimates sit slightly below zero, and neither was statistically significant. The intervals are wide, though: the visual one reaches 0.58, above the 0.41 that the review cites as a minimum for a practical effect. This page found no correction for publication bias in the review.
[status not assigned] Matching teaching to a visual or auditory learning style; 11 experiments pooled from 10 studies found up to January 2018; tests after the teaching. The intervals are too wide, and no bias correction was found, to call the claim not supported. Based on full text. Checked 2026-11-06.
By Aslaksen and Lorås's account, only one of the 10 studies followed Pashler's criteria fully: a 2015 study by Beth Rogowsky, Barbara Calhoun and Paula Tallal, titled “Matching learning style to instructional method: Effects on comprehension.” The team's 2020 paper describes that study as one with adult learners. This page read the 2015 paper only as a citation.
A test in fifth graders
The same team then ran the design with children. In a 2020 study, 125 fifth graders aged 10 and 11 at one public school in rural Pennsylvania took part. Each student heard some reading-test passages through earbuds and read others on an iPad, in counterbalanced order, and answered written questions after each passage. On the third day they took a learning-style inventory built for ages 10 to 13.
Of the 107 students with both comprehension and inventory scores, only 34 had a clear preference: 22 visual and 12 auditory. Students with a visual preference scored higher whether they listened or read, a mean of 39.07 vs 28.58 for the auditory group. Both groups scored a little higher after listening than after reading, so the lines never cross, and the interaction that matching predicts was not significant (p = 0.29).
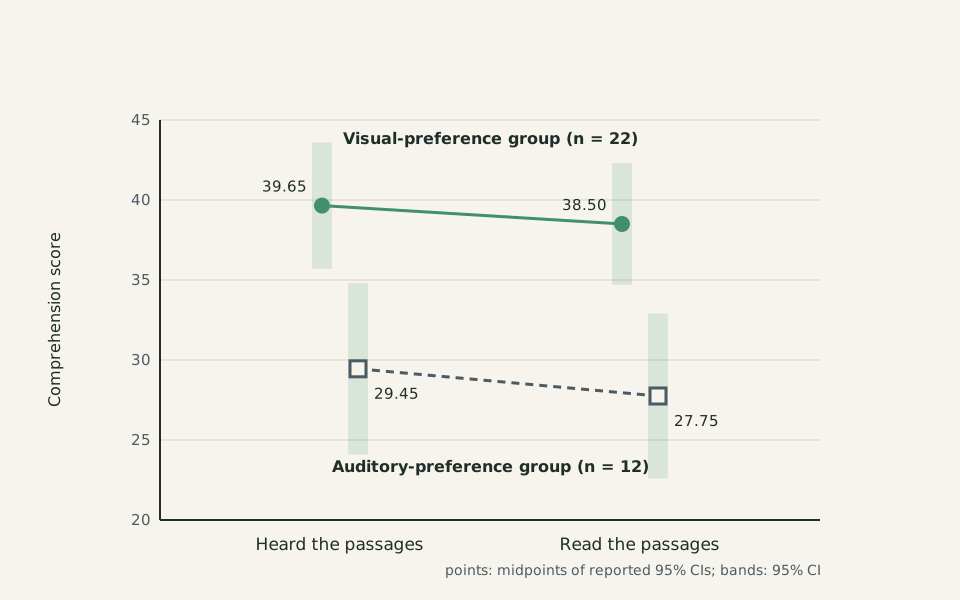
Diagram: Feedback & Forgetting, CC BY 4.0
Copy the credit line
"Fifth graders: scores after hearing or reading, by stated preference" by Feedback & Forgetting, https://feedbackandforgetting.com/learning-memory/learning-styles/, licensed under CC BY 4.0, https://creativecommons.org/licenses/by/4.0/Data: Rogowsky, B. A., Calhoun, B. M., & Tallal, P. (2020). Providing instruction based on students' learning style preferences does not improve learning. Frontiers in Psychology 11: 164, doi:10.3389/fpsyg.2020.00164, Results and Figure 2 legend (95% confidence intervals), CC BY 4.0 (https://creativecommons.org/licenses/by/4.0/)
Mean comprehension scores, shown as the midpoints of the 95% confidence intervals reported in the 2020 study, for students with a clear visual or auditory preference.
Replication tag: [single study] Fifth graders with a clear visual or auditory preference at one school, 22 and 12 students; reading-test passages heard or read, questions right after each passage. The earlier 2015 test, in adults by the team's own description, is by the same team, so it is not an independent replication. Based on full text. Checked 2026-11-06.
The authors list their own limits: one school, written questions in both modes, and no way to tell how the result extends to other styles or materials. Their power analysis called for at least 76 students to detect a moderate effect, but the key comparison, limited to students with a clear preference, includes 34.
Preferences are real
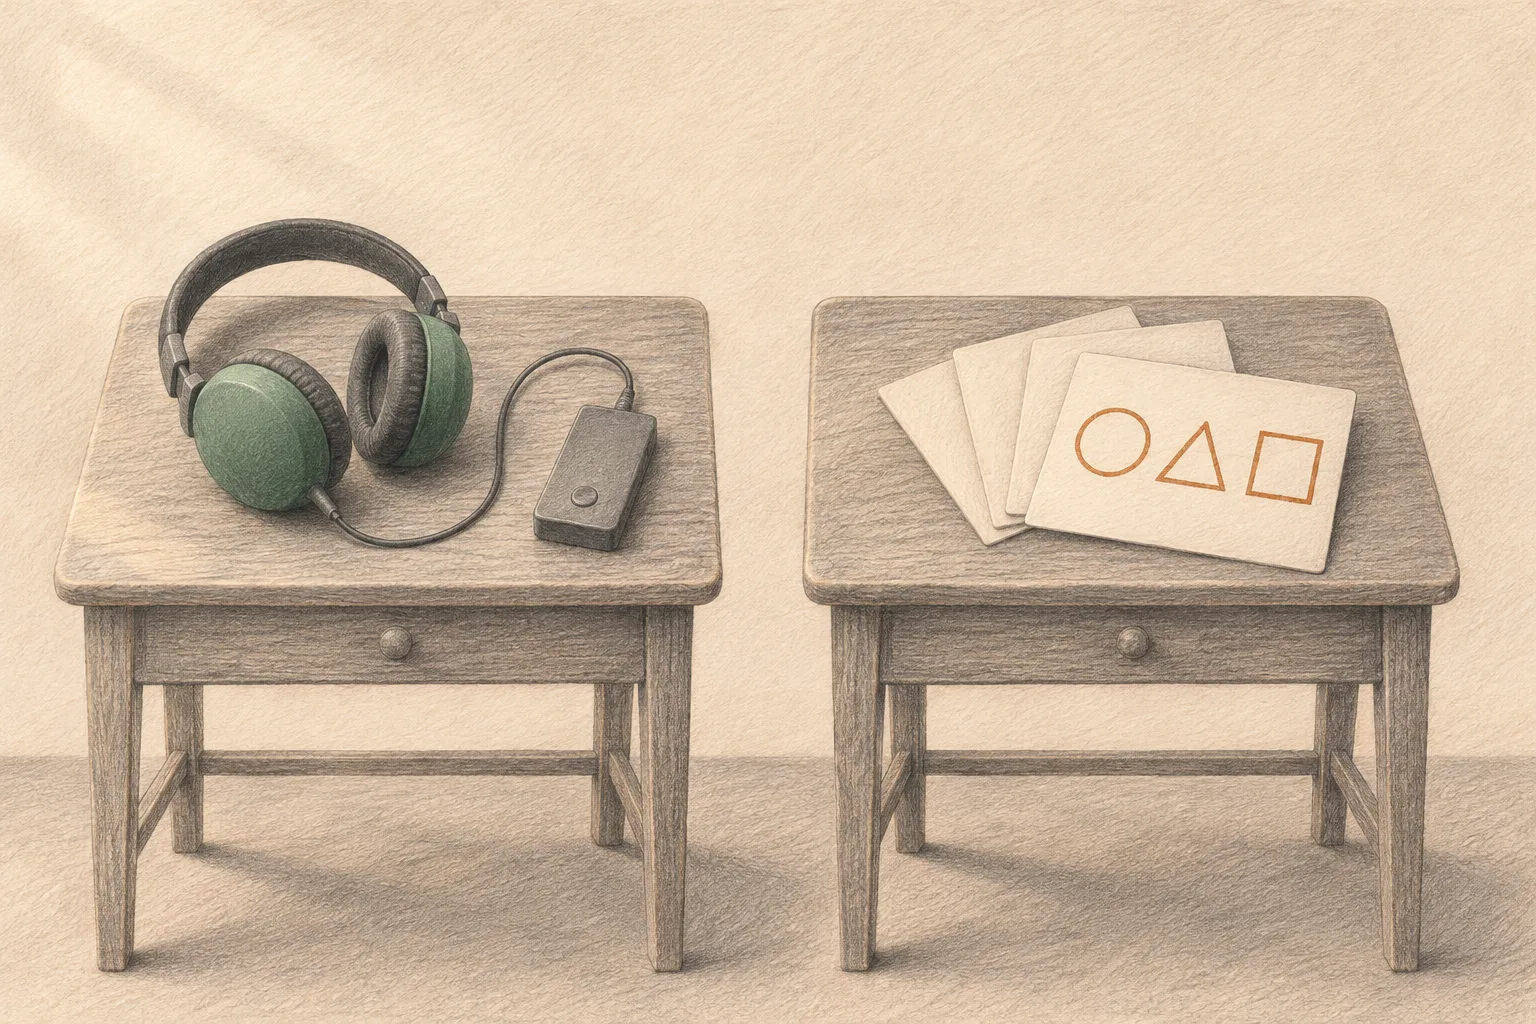
Illustration: Feedback & Forgetting. Generated schematic illustration — not a photograph or historical record. © Feedback & Forgetting, all rights reserved.
Two ways of taking in the same material, by ear or by eye. Stating a preference for one is common; whether matching teaching to it helps is the separate question this page checks. A scene illustration, not a result.
None of this says people lack preferences. In the same teacher survey, more than 80% of teachers correctly accepted a statement that learners show preferences for the way they receive information. The 2008 review, according to its abstract, found ample evidence that children and adults will state preferences when asked, and that people differ in some specific aptitudes.
Preferences are not always clear, though. In the 2020 study, 73 of 107 fifth graders, or 68%, had similar auditory and visual scores on the inventory. Rogowsky and colleagues add that having preferences has never been in question; what is debated is whether learning in the preferred mode raises achievement.
Teaching in several formats is a separate matter. Macdonald and colleagues describe how, in classroom practice, teachers weave pictures and spoken explanation into one lesson for the whole class, rather than splitting children by style. They suggest that this mix may help through repetition, a possible explanation drawn from earlier reviews, not something the learning-styles studies tested.
This page does not rate any questionnaire, VARK included. In Newton's count, VAK-type schemes, a family that includes VARK, appeared in 33% of the papers, and Kolb's scheme in 34%. The question here is narrower: whether teaching to the result of such a questionnaire improves learning.
Verdict and what to do instead
On the matching claim, this page assigns no status yet. The readable evidence leans one way: a 2018 review pooling 11 experiments from 10 studies reported effects close to zero and slightly negative, and a 2020 test in fifth graders found no significant matching benefit. The pooled intervals are wide and no bias correction was found, so the evidence falls short of the precision this site requires for not supported.
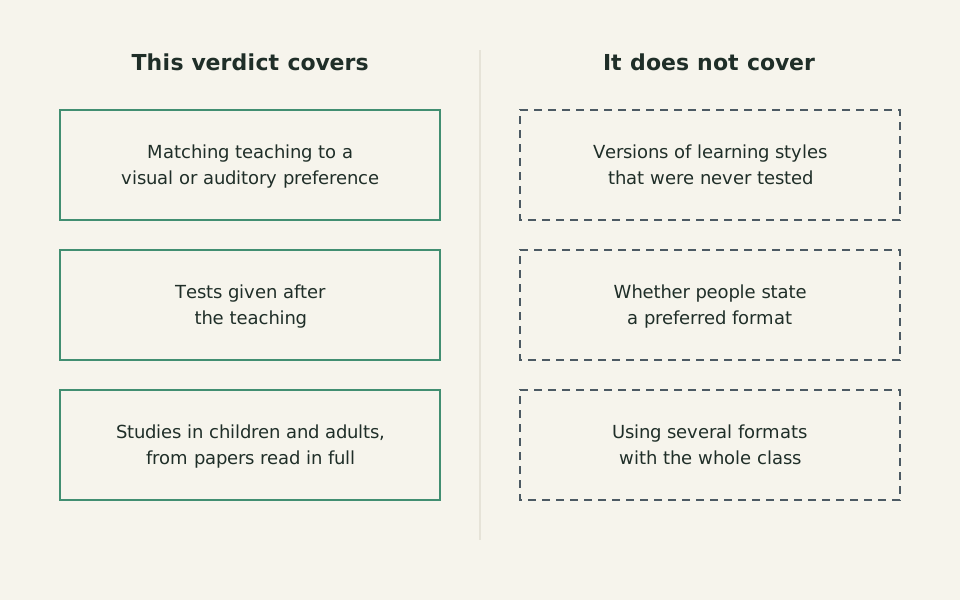
Diagram: Feedback & Forgetting, CC BY 4.0
Copy the credit line
"What the verdict on learning styles covers" by Feedback & Forgetting, https://feedbackandforgetting.com/learning-memory/learning-styles/, licensed under CC BY 4.0, https://creativecommons.org/licenses/by/4.0/What this page's verdict covers and what it leaves out. Each item is described in the text above.
For practice, this site does not recommend building lessons or study sessions around a learning-style label, because the tests designed to check matching have not supported it. That stance is about matching only; preferences and mixed formats stay outside it.
Methods with stronger delayed-test evidence exist. This site's review of active recall covers one: closing the book and recalling, which beat rereading on delayed tests in the studies that review reads at abstract level. Learning styles also sit on this site's scorecard of learning myths and neuromyths, next to other popular claims and the studies behind them.
Next time a quiz labels you a visual or auditory learner, keep the format you enjoy if it helps you start. Then end the session by closing your notes and writing down what you can recall.
Data: Learning-styles evidence, row by row
| Claim | Study | Value (quoted) | Value (recomputed) | Read as | Status |
|---|---|---|---|---|---|
| Teachers who agreed with the learning-styles statement, UK | Dekker, Lee, Howard-Jones & Jolles 2012 | 93% of teachers | — | full text | — |
| Teachers who agreed with the learning-styles statement, Netherlands | Dekker, Lee, Howard-Jones & Jolles 2012 | 96% of teachers | — | full text | — |
| Teachers who agreed, both countries combined | Dekker, Lee, Howard-Jones & Jolles 2012 | — | about 94.3 ((93 x 137 + 96 x 105) / 242; assumes every teacher answered this statement) | full text | — |
| Teachers who had met learning styles in their school, UK | Dekker, Lee, Howard-Jones & Jolles 2012 | 98% of teachers | — | full text | — |
| Teachers who had met learning styles in their school, Netherlands | Dekker, Lee, Howard-Jones & Jolles 2012 | 64% of teachers | — | full text | — |
| Educators who agreed with the learning-styles statement, United States | Macdonald, Germine, Anderson, Christodoulou & McGrath 2017 | 76% of group | — | full text | — |
| General public who agreed with the learning-styles statement, United States | Macdonald, Germine, Anderson, Christodoulou & McGrath 2017 | 93% of group | — | full text | — |
| People with many neuroscience courses who agreed, United States | Macdonald, Germine, Anderson, Christodoulou & McGrath 2017 | 78% of group | — | full text | — |
| Recent higher-education papers that concluded in favor of learning styles | Newton 2015 | 89% of papers | 89 (97 / 109 x 100) | full text | — |
| Of those papers, how many tested the matching claim | Newton 2015 | 1 of 109 papers | — | full text | — |
| Studies found with a design able to test matching | Aslaksen & Lorås 2018 | 10 studies | — | full text | — |
| Pooled effect of matching instruction to a visual learning style | Aslaksen & Lorås 2018 | −0.09 Hedges' g; 95% CI −0.74 to 0.58; p = 0.80 | — | full text | [status not assigned] |
| Pooled effect of matching instruction to an auditory learning style | Aslaksen & Lorås 2018 | −0.27 Hedges' g; 95% CI −0.87 to 0.32; p = 0.37 | — | full text | [status not assigned] |
| Fifth graders with no clear auditory or visual preference | Rogowsky, Calhoun & Tallal 2020 | 68% of students | 68.2 (73 / 107 x 100) | full text | — |
| Matching interaction between preference and teaching mode | Rogowsky, Calhoun & Tallal 2020 | 0.29 p value; not significant | — | full text | Replication tag: [single study] |
| Mean comprehension score, visual-preference group, both modes | Rogowsky, Calhoun & Tallal 2020 | 39.07 test score | — | full text | — |
| Mean comprehension score, auditory-preference group, both modes | Rogowsky, Calhoun & Tallal 2020 | 28.58 test score | — | full text | — |
| Listening score, visual-preference group | Rogowsky, Calhoun & Tallal 2020 | 35.7 to 43.6 test score, 95% CI | 39.65 ((35.7 + 43.6) / 2, midpoint of the reported 95% CI) | full text | — |
| Listening score, auditory-preference group | Rogowsky, Calhoun & Tallal 2020 | 24.1 to 34.8 test score, 95% CI | 29.45 ((24.1 + 34.8) / 2, midpoint of the reported 95% CI) | full text | — |
| Reading score, visual-preference group | Rogowsky, Calhoun & Tallal 2020 | 34.7 to 42.3 test score, 95% CI | 38.5 ((34.7 + 42.3) / 2, midpoint of the reported 95% CI) | full text | — |
| Reading score, auditory-preference group | Rogowsky, Calhoun & Tallal 2020 | 22.6 to 32.9 test score, 95% CI | 27.75 ((22.6 + 32.9) / 2, midpoint of the reported 95% CI) | full text | — |
| Very few studies used a design able to test matching, and several of those contradicted it | Pashler, McDaniel, Rohrer & Bjork 2008 | — | — | abstract | [status not assigned] |
Download the data (CSV, learning-styles-evidence.csv) · Where each value comes from (JSON) Data: Dekker, S., Lee, N. C., Howard-Jones, P., & Jolles, J. (2012). Frontiers in Psychology 3: 429, doi:10.3389/fpsyg.2012.00429, Creative Commons Attribution License (version not stated); Macdonald, K., Germine, L., Anderson, A., Christodoulou, J., & McGrath, L. M. (2017). Frontiers in Psychology 8: 1314, doi:10.3389/fpsyg.2017.01314, CC BY 4.0 (https://creativecommons.org/licenses/by/4.0/); Newton, P. M. (2015). Frontiers in Psychology 6: 1908, doi:10.3389/fpsyg.2015.01908, CC BY 4.0 (https://creativecommons.org/licenses/by/4.0/); Aslaksen, K., & Lorås, H. (2018). Frontiers in Psychology 9: 1538, doi:10.3389/fpsyg.2018.01538, CC BY 4.0 (https://creativecommons.org/licenses/by/4.0/); Rogowsky, B. A., Calhoun, B. M., & Tallal, P. (2020). Frontiers in Psychology 11: 164, doi:10.3389/fpsyg.2020.00164, CC BY 4.0 (https://creativecommons.org/licenses/by/4.0/)
The replication scorecard at the top of this page, as a CSV file · Where each value comes from (JSON) Data: Dekker, S., Lee, N. C., Howard-Jones, P., & Jolles, J. (2012). Frontiers in Psychology 3: 429, doi:10.3389/fpsyg.2012.00429, Creative Commons Attribution License (version not stated); Aslaksen, K., & Lorås, H. (2018). Frontiers in Psychology 9: 1538, doi:10.3389/fpsyg.2018.01538, CC BY 4.0 (https://creativecommons.org/licenses/by/4.0/); Rogowsky, B. A., Calhoun, B. M., & Tallal, P. (2020). Frontiers in Psychology 11: 164, doi:10.3389/fpsyg.2020.00164, CC BY 4.0 (https://creativecommons.org/licenses/by/4.0/)
Retrieval check
Answer from memory first, then follow the link to the passage and check.
- To test the matching claim, what pattern does an experiment have to show? Back to the passage
- How is having a preferred format different from benefiting from matched teaching? Back to the passage
- What does this site suggest doing at the end of a study session instead? Back to the passage · How active recall compares with rereading
Sources
- Dekker, S., Lee, N. C., Howard-Jones, P., & Jolles, J. (2012). Neuromyths in education: Prevalence and predictors of misconceptions among teachers. Frontiers in Psychology, 3, 429. doi:10.3389/fpsyg.2012.00429 https://doi.org/10.3389/fpsyg.2012.00429
- Pashler, H., McDaniel, M., Rohrer, D., & Bjork, R. (2008). Learning styles: Concepts and evidence. Psychological Science in the Public Interest, 9(3), 105–119. doi:10.1111/j.1539-6053.2009.01038.x https://doi.org/10.1111/j.1539-6053.2009.01038.x
- Macdonald, K., Germine, L., Anderson, A., Christodoulou, J., & McGrath, L. M. (2017). Dispelling the myth: Training in education or neuroscience decreases but does not eliminate beliefs in neuromyths. Frontiers in Psychology, 8, 1314. doi:10.3389/fpsyg.2017.01314 https://doi.org/10.3389/fpsyg.2017.01314
- Newton, P. M. (2015). The learning styles myth is thriving in higher education. Frontiers in Psychology, 6, 1908. doi:10.3389/fpsyg.2015.01908 https://doi.org/10.3389/fpsyg.2015.01908
- Aslaksen, K., & Lorås, H. (2018). The modality-specific learning style hypothesis: A mini-review. Frontiers in Psychology, 9, 1538. doi:10.3389/fpsyg.2018.01538 https://doi.org/10.3389/fpsyg.2018.01538
- Rogowsky, B. A., Calhoun, B. M., & Tallal, P. (2015). Matching learning style to instructional method: Effects on comprehension. Journal of Educational Psychology, 107(1), 64–78. doi:10.1037/a0037478 https://doi.org/10.1037/a0037478
- Rogowsky, B. A., Calhoun, B. M., & Tallal, P. (2020). Providing instruction based on students' learning style preferences does not improve learning. Frontiers in Psychology, 11, 164. doi:10.3389/fpsyg.2020.00164 https://doi.org/10.3389/fpsyg.2020.00164
- Crossref. Update searches (corrections, retractions, expressions of concern) for doi:10.3389/fpsyg.2012.00429, doi:10.1111/j.1539-6053.2009.01038.x, doi:10.3389/fpsyg.2017.01314, doi:10.3389/fpsyg.2015.01908, doi:10.3389/fpsyg.2018.01538, doi:10.1037/a0037478 and doi:10.3389/fpsyg.2020.00164. https://api.crossref.org/works?filter=updates:10.1111/j.1539-6053.2009.01038.x
Cite this page
Feedback & Forgetting. (2026-11-06). Do Learning Styles Work? A 2008 Review Found Few Fair Tests. https://feedbackandforgetting.com/learning-memory/learning-styles/ (accessed [date you read it])
No DOI is assigned to this page; cite the address above with the date you read it.
Related reading
-
Learning & Memory
Forgetting Curve: It Measured Relearning, Not Recall
Picture credit
"Zeitschrift fur Psychologie, 1909: Herman Ebbinghaus" by Wellcome Collection — https://commons.wikimedia.org/wiki/File:Zeitschrift_fur_Psychologie,_1909;_Herman_Ebbinghaus._Wellcome_L0003734.jpg — CC BY 4.0 (https://creativecommons.org/licenses/by/4.0/); modifications: cropped mount, padded
-

Learning & Memory
Spaced Repetition: Should Review Gaps Grow? Studies Disagree
Picture credit
Illustration: Feedback & Forgetting. Generated schematic illustration — not a photograph or historical record. © Feedback & Forgetting, all rights reserved.
-
Learning & Memory
Active Recall: Quizzing Beat Rereading Later in a 2006 Study
Picture credit
"Mental Arithmetic. In Public School of S. A. Rachinsky" by Nikolay Bogdanov-Belsky — https://commons.wikimedia.org/wiki/File:Bogdanov-Belsky_Ustny_Schet_(Tretyakov).jpg — Public domain (PD-Art; painter d. 1945 (EU: from 2016; US: published before 1931, per the Commons file page)); modifications: cropped