Feedback Loop Examples: Which Ones Have a Test on Record
Case breakdown Feedback & Forgetting Published
Short answer. A feedback loop is a chain of cause and effect that circles back to its own start, so a change ends up feeding more change. A balancing (negative) loop pulls a change back toward a target, the way a governor holds a steam engine's speed; an amplifying (positive) loop pushes a change further. Some everyday loops have a test on record: jams forming on a closed loop of road with no bottleneck, a governor that jerked when tuned too hard, and a thermostat logged in one flat. Others, like a study-habit loop drawn on this page, are sketches that nothing cited here has tested.
In one sentence: A loop diagram is a sketch, not evidence: of the everyday feedback loops on this page, only some have a test cited here, and a traffic jam with no bottleneck is one.
Outline6 sections
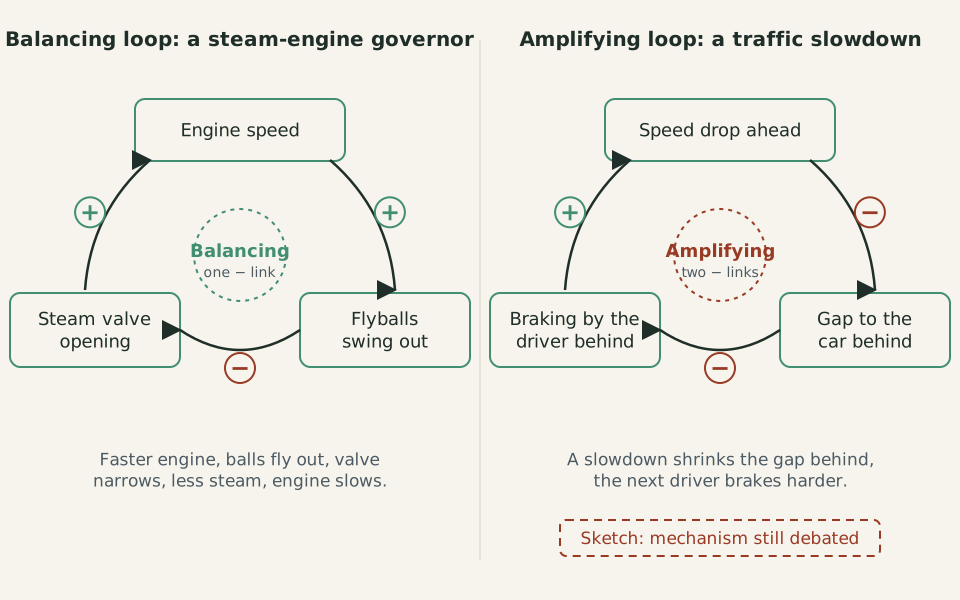
Diagram: Feedback & Forgetting, CC BY 4.0
Copy the credit line
"Two kinds of feedback loop" by Feedback & Forgetting, https://feedbackandforgetting.com/systems-loops/feedback-loops/, licensed under CC BY 4.0, https://creativecommons.org/licenses/by/4.0/Two loops drawn the same way. Each arrow carries a sign: + when both ends move the same way, − when they move in opposite directions. A loop with an odd number of − links is balancing, and one with an even number is amplifying. The traffic loop is a sketch, not a tested mechanism.
In 2008, an experiment titled “Traffic jams without bottlenecks” appeared in the New Journal of Physics. The full title goes on to promise “experimental evidence for the physical mechanism of the formation of a jam”. By the account of a 2026 paper, drivers in this kind of ring test followed each other in single file around a large loop, and once the cars were packed densely enough, stop-and-go waves appeared. Which everyday feedback loops have been put to a test like that, and which are only drawn?
This page takes five everyday systems and logs each one: the loop as this page sketches it, whether anyone tested it, and how much of that test could be read here. A sixth loop, about grades and studying, was drawn on purpose with no test cited for it. The full ledger is a CSV at the end.
A jam with no bottleneck
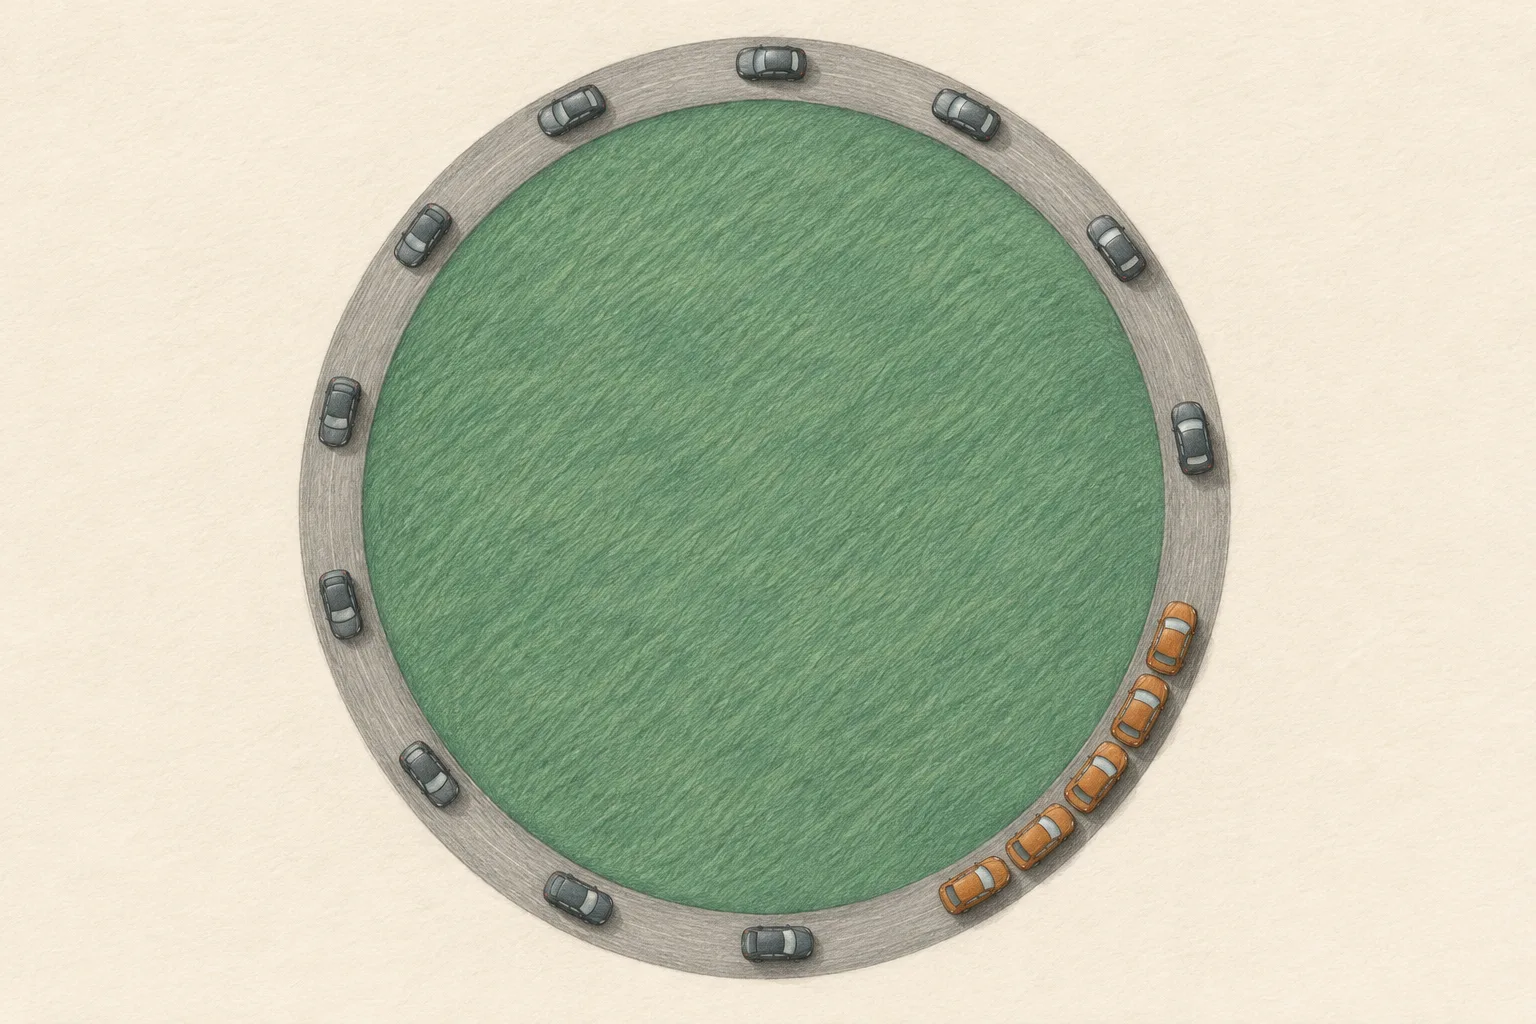
Illustration: Feedback & Forgetting. Generated schematic illustration — not a photograph or historical record. © Feedback & Forgetting, all rights reserved.
A ring road seen from above, with one place where cars have bunched up. A sketch of the kind of closed course described in the ring tests, not a record of any experiment.
A bottleneck is anything on the road that forces cars to slow, such as a lane closure, a merge or a sharp bend. The 2008 experiment, going by its title, set out to show a jam forming without one. Only the paper's citation could be read for this page, so none of its measurements appear here.
A 2026 paper in PNAS Nexus by Oscar Dufour and five coauthors describes what such ring tests showed. Its figure of the 2008 experiment's car paths shows traffic that starts out disordered and sorts itself into stop-and-go waves moving backward, against the direction of travel. A loop sketch for this is amplifying: a car ahead slows, the gap behind it shrinks, the next driver brakes harder, and the slowdown passes back down the line.
That loop is still a sketch. The 2026 authors write that the physical origin of these waves is “still a matter of debate, even for single-file traffic.” In the ring tests, by their reading, the waves appeared after irregular waiting periods instead of growing steadily from one small disturbance, which the simplest amplifying story does not predict. So the jam is on record as a test result, while the loop that explains it is still argued over.
Field work followed. A 2018 paper by Raphael Stern and colleagues is titled “Dissipation of stop-and-go waves via control of autonomous vehicles: Field experiments.” Only its citation was read, so this page cannot say what those experiments found.
The governor: a loop you can hold
"Boulton and Watt centrifugal governor" by Andy Dingley — https://commons.wikimedia.org/wiki/File:Boulton_and_Watt_centrifugal_governor.jpg — CC BY 3.0 (https://creativecommons.org/licenses/by/3.0/); modifications: cropped
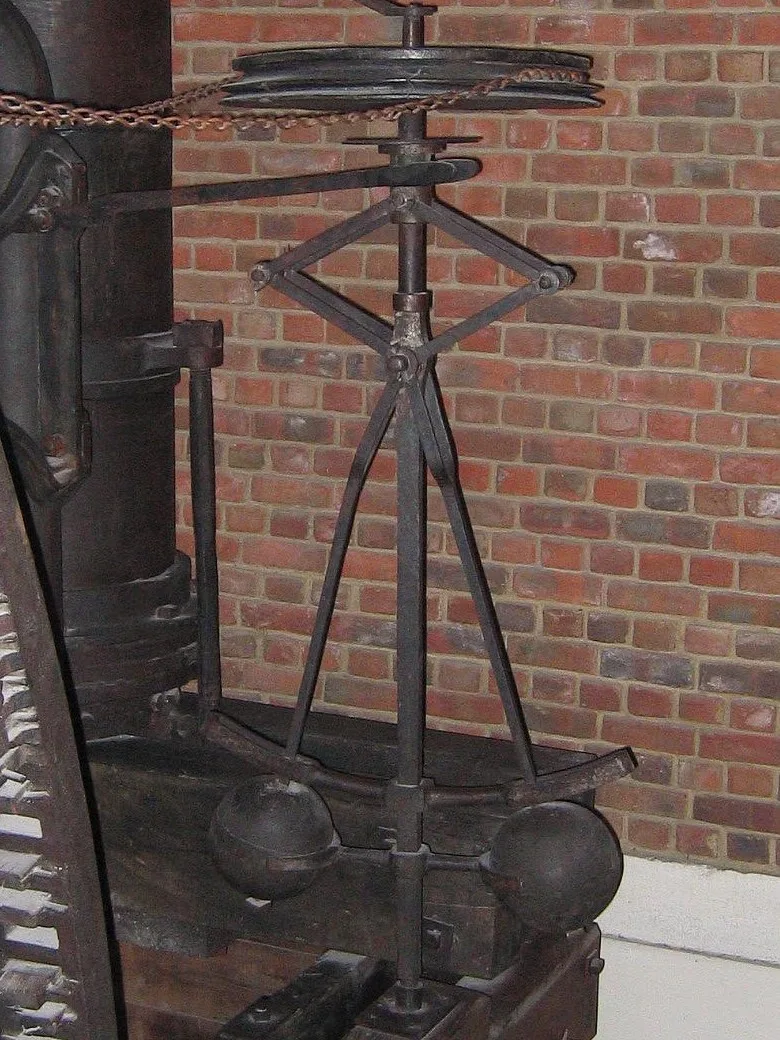
Watt's centrifugal governor of 1788 on the Boulton and Watt “Lap Engine,” Science Museum, London. Photograph, 2008.
James Clerk Maxwell opened his 1868 paper “On Governors” with a definition: “A Governor is a part of a machine by means of which the velocity of the machine is kept nearly uniform, notwithstanding variations in the driving power or the resistance” (p. 270). In James Watt's governor for steam engines, Maxwell explained, “the arms open outwards, and so contract the aperture of the steam-valve” (p. 271). That is a balancing loop you can see: the engine speeds up, the spinning balls swing out, the valve narrows, less steam gets through, and the engine slows.
Maxwell's paper also records what happened when a balancing loop was pushed too hard. If a governor's regulating power is turned up, he wrote, there is generally a limit at which the disturbance, “instead of subsiding more rapidly, becomes an oscillating and jerking motion” (p. 272). He gave the case of a governor built by Fleeming Jenkin with adjustable settings. Set to regulate faster and faster, it broke into a “dancing motion,” and the main shaft jerked.
That account is the closest thing to a test in the 1868 paper: one adjustable machine, described in words, with no measurements printed. Still, the point carries over to the next two systems: a balancing loop does not promise calm. In Maxwell's account, a correction made too strong turned into swinging back and forth.
The thermostat on your wall
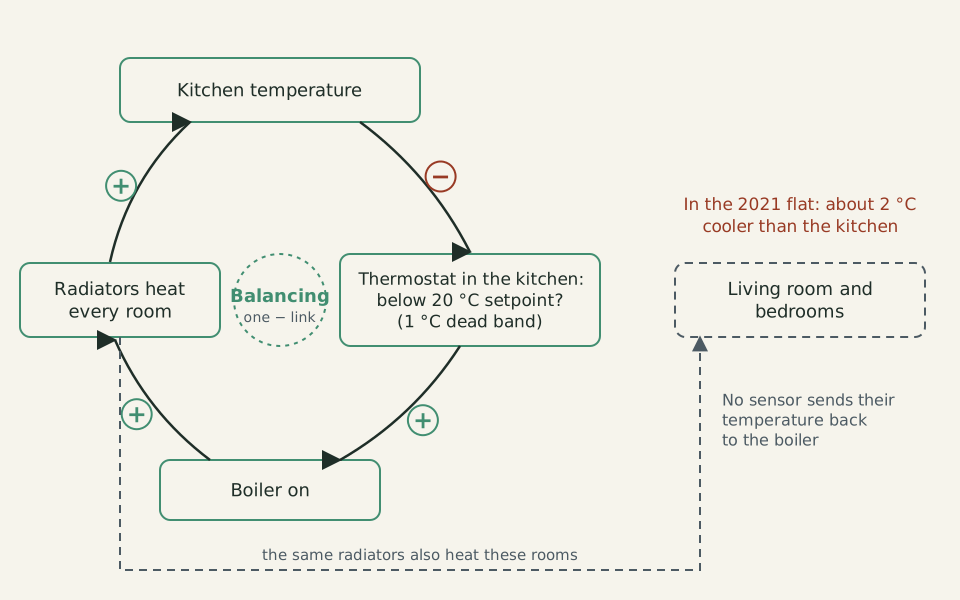
Diagram: Feedback & Forgetting, CC BY 4.0
Copy the credit line
"A thermostat loop that sees one room" by Feedback & Forgetting, https://feedbackandforgetting.com/systems-loops/feedback-loops/, licensed under CC BY 4.0, https://creativecommons.org/licenses/by/4.0/A balancing loop with one blind spot. The thermostat reads one room, so the dashed branch, the rest of the flat, never feeds back to the boiler. Setpoint and dead band are those of the flat monitored in the 2021 study.
A home thermostat runs the same kind of loop as a governor, with temperature in place of speed. When the room falls below the setpoint, the thermostat switches the heat on, and once the room reaches it, the heat goes off. In a 2021 study in Sensors, Federico Seri and three coauthors monitored one flat in Jesi, Italy. In their words, “The thermostat, placed inside the kitchen, provided the air temperature value measured in that zone as feedback to the boiler.”
The loop worked for the room it could sense. On the day the authors describe, the morning heating ran from 7 to 9 a.m., and the boiler stopped around 8 a.m., when the kitchen reached its 20 °C setpoint. A 1 °C dead band, a margin the temperature has to fall through before the heat comes back on, kept the boiler off until that heating period ended at 9 a.m. During those two morning hours, the authors report, the other rooms ran about 2 °C cooler than the kitchen.
That is a measured loop, though a small one: one flat, four room sensors, the second half of December. It shows a limit that a loop diagram can hide. The boiler answered only to the kitchen sensor, and the rooms that sensor could not read ran cooler.
What people believe about this loop is another matter. A 1986 paper by Willett Kempton in Cognitive Science, “Two theories of home heat control,” drew on in-depth interviews about home heating. According to its abstract, people used two theories to understand and set their thermostats, a feedback theory and a valve theory. The abstract calls the valve theory inconsistent with engineering knowledge, yet suggests it may work well enough in everyday use.
[status not assigned] People interviewed about home heating and thermostat setting; one interview study, no sample size in the abstract. Based on the abstract. Checked 2026-11-06.
Bathtubs and stocks
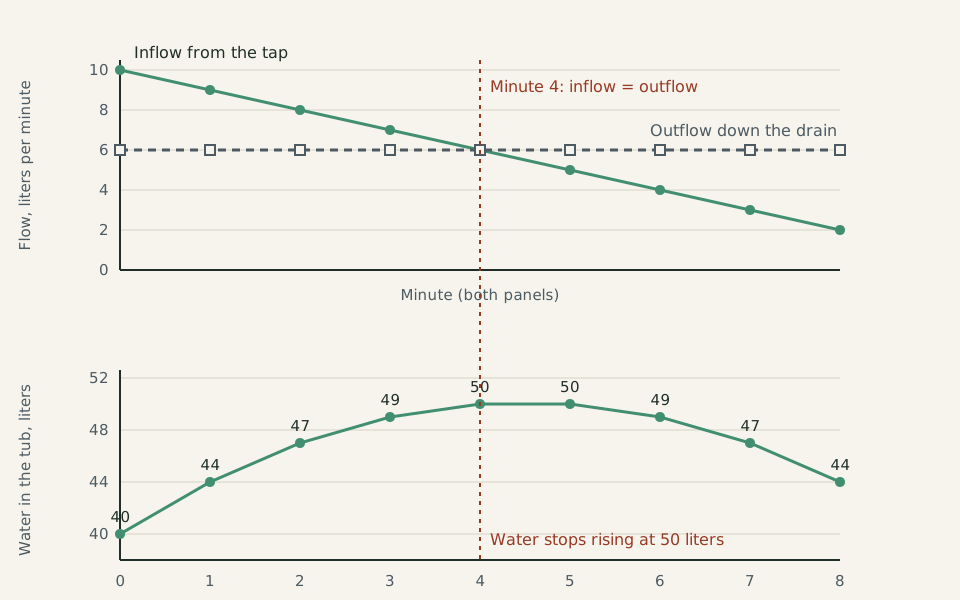
Diagram: Feedback & Forgetting, CC BY 4.0
Copy the credit line
"A bathtub stock with a falling inflow" by Feedback & Forgetting, https://feedbackandforgetting.com/systems-loops/feedback-loops/, licensed under CC BY 4.0, https://creativecommons.org/licenses/by/4.0/Illustrative numbers, not data: a tap that slows by one liter per minute each minute, a drain that takes 6 liters per minute, and a tub that starts with 40 liters. Each minute, the water changes by inflow minus outflow.
Some systems are easier to read as a stock and its flows than as a loop. A stock is an amount that builds up, like the water in a bathtub, and a flow is a rate that changes it, like the tap filling the tub or the drain emptying it. The stock changes only by inflow minus outflow. It keeps rising for as long as the inflow is larger, even while the inflow is falling.
The chart puts made-up numbers on that rule. The tap slows every minute from 10 liters per minute, while the drain takes a steady 6. The water still rises from 40 to 50 liters, and it stops rising only at minute 4, when the tap has slowed to 6 liters per minute and matches the drain.
Researchers have also turned bathtub questions into tests of people. A 2000 paper by Linda Booth Sweeney and John Sterman, “Bathtub dynamics: initial results of a systems thinking inventory,” set short tasks on ideas such as feedback, delays, and stocks and flows. According to its abstract, participants from one elite business school, with essentially no prior exposure to system dynamics, understood stock and flow relationships and time delays poorly, and how well they did showed no systematic link to prior education, age or national origin. The abstract gives no scores, so this page reports none.
[status not assigned] Business school participants new to system dynamics; short stock-and-flow and delay tasks; initial results of one inventory. Based on the abstract. Checked 2026-11-06.
A 2009 paper by Matthew Cronin, Cleotilde Gonzalez and John Sterman asks in its title, “Why don’t well-educated adults understand accumulation?” Only its citation was read here.
Those two papers are about people's grasp of accumulation, not the tub itself. The bathtub itself needs no experiment. Its arithmetic settles the question. The 2009 title, though, treats a failure to understand that arithmetic as the thing to be explained.
The beer game
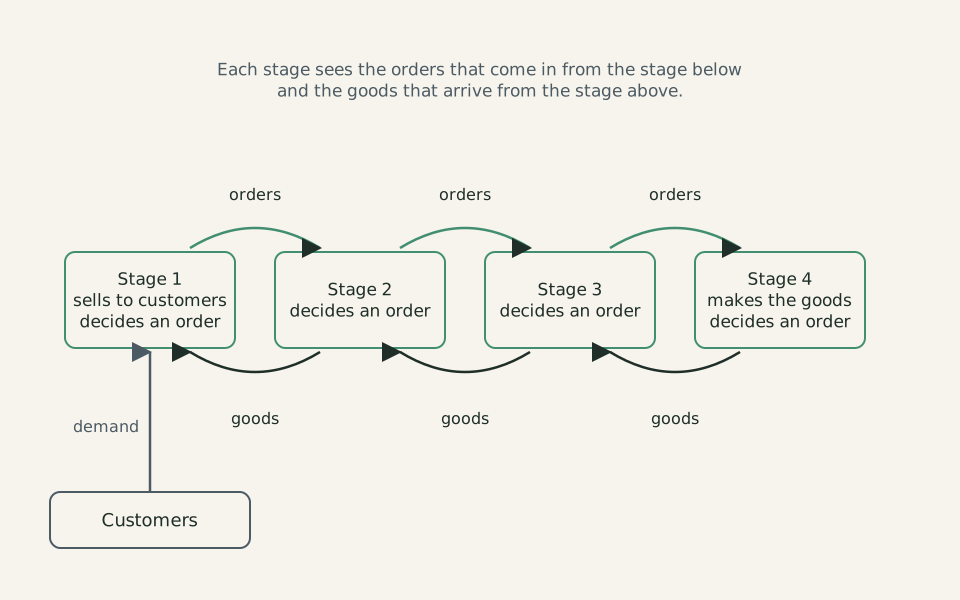
Diagram: Feedback & Forgetting, CC BY 4.0
Copy the credit line
"A beer game supply chain, schematic" by Feedback & Forgetting, https://feedbackandforgetting.com/systems-loops/feedback-loops/, licensed under CC BY 4.0, https://creativecommons.org/licenses/by/4.0/A schematic of the kind of chain the beer game simulates, drawn by this site with four stages. Orders move up the chain and goods move back down it.
The beer game is a supply-chain game in which, as a 2020 paper in PLOS ONE by Rozhin Doroudi and seven coauthors puts it, “humans played the roles of different decision makers.” As described by that paper, a 2008 study by Rong, Shen and Snyder considered this classic framework and studied how much order amounts varied in a disrupted supply chain. By that account, when a disruption occurred, order variability increased from one level of the chain to the next.
One way to draw the loop behind that pattern is this. A stage that runs short orders more, but the goods arrive only after a delay, so it may order again before they land and then end up with too much. Its swings in ordering reach the stage above as bigger and smaller orders. This page did not read the 2008 study itself, so it cannot say how that result was obtained, and the loop stays a sketch of a result described secondhand.
John Sterman's 1989 paper in Management Science has a title that names the problem: “Modeling Managerial Behavior: Misperceptions of Feedback in a Dynamic Decision Making Experiment.” According to its abstract, participants managed a simulated inventory distribution system with several actors, feedback and time delays, and the results drifted systematically away from the optimal path. The abstract puts the poor performance down to misperceptions of feedback, chiefly that participants took little account of how their own decisions fed back on the system. It does not use the name beer game, and this page did not read the paper's design.
[status not assigned] Participants managing a simulated inventory distribution system; one experiment. Based on the abstract. Checked 2026-11-06.
A loop with no test cited
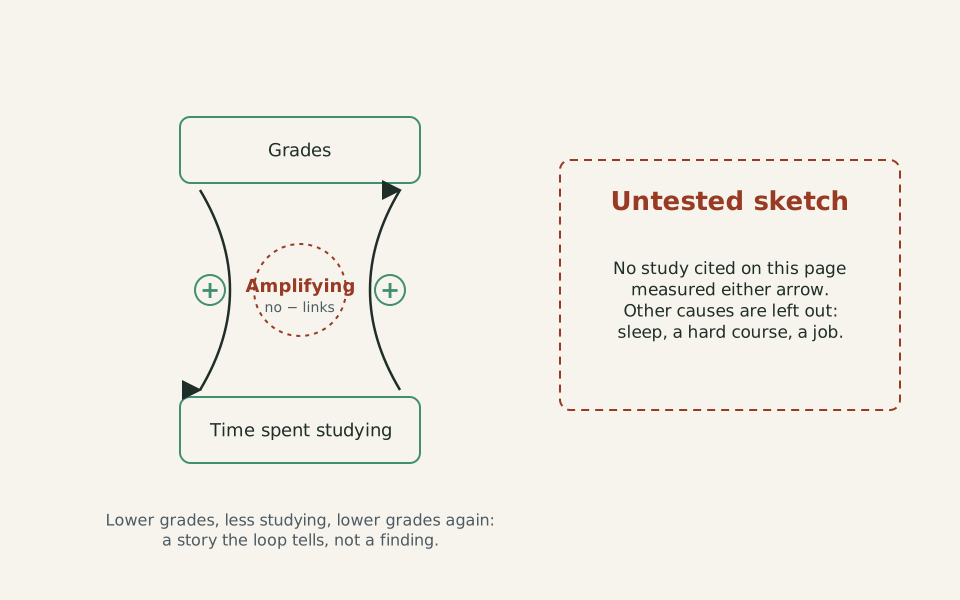
Diagram: Feedback & Forgetting, CC BY 4.0
Copy the credit line
"An untested loop: grades and studying" by Feedback & Forgetting, https://feedbackandforgetting.com/systems-loops/feedback-loops/, licensed under CC BY 4.0, https://creativecommons.org/licenses/by/4.0/A loop drawn for this page with no test cited for it. Both links carry a plus sign, so on paper it amplifies.
Here is a loop drawn for this page: low grades lead to less studying, which leads to lower grades. Both arrows carry a plus sign, so on paper the loop is amplifying, and it reads like a trap that tightens by itself. No study cited on this page measured either arrow. A diagram like this leaves out every other cause, from sleep to a hard course to a paid job, and it cannot show which arrow is strong and which is weak.
Famous loop stories can rest on thin records too. This site's search for the source of the cobra bounty story checks one against what could be found. The same check applies to one-line laws about systems; this site follows Goodhart's law back to where it began.
A term this site uses
Loop literacy
This site uses loop literacy as the name of a teaching goal for its systems pages: being able to spot a feedback loop by hand in an everyday scene, such as a traffic jam, a thermostat or the stock and flows of a bathtub. It is not a research construct, and no test or scale on this page measures it. The five checks below add one more habit on top of spotting a loop: asking whether anyone tested it.
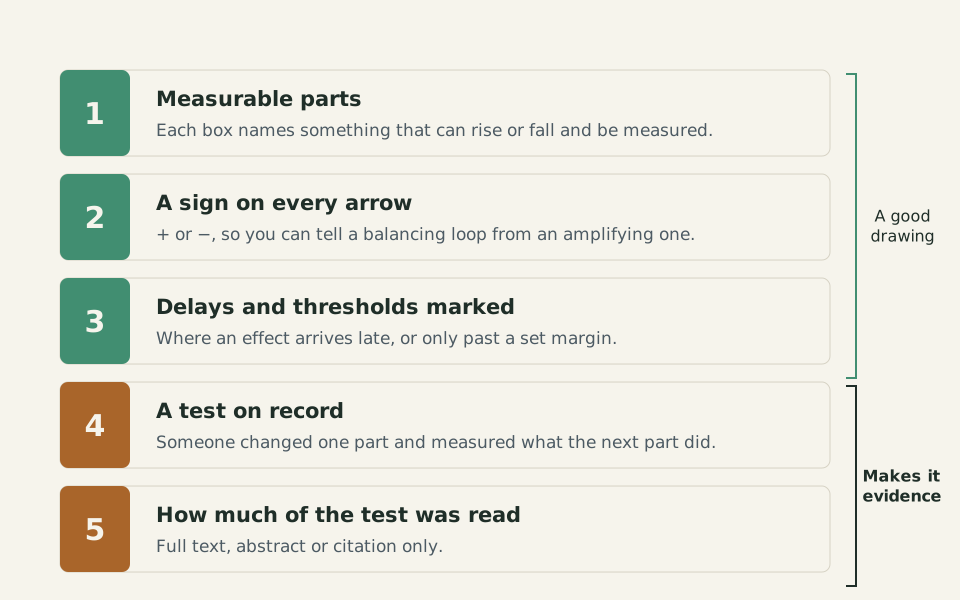
Diagram: Feedback & Forgetting, CC BY 4.0
Copy the credit line
"Five checks before a loop diagram counts as evidence" by Feedback & Forgetting, https://feedbackandforgetting.com/systems-loops/feedback-loops/, licensed under CC BY 4.0, https://creativecommons.org/licenses/by/4.0/The first three checks make a good drawing. Only the last two make it evidence.
| Check | What to look for | Example on this page |
|---|---|---|
| 1. Measurable parts | Each box names something that can rise or fall and be measured | Kitchen temperature; water in the tub |
| 2. A sign on every arrow | + or −, so you can tell a balancing loop from an amplifying one | One − link in the governor loop |
| 3. Delays and thresholds marked | Where an effect arrives late, or only past a set margin | The thermostat's 1 °C dead band |
| 4. A test on record | Someone changed one part and measured what the next part did | Maxwell's 1868 account of an adjustable governor |
| 5. How much of the test was read | Full text, abstract or citation only | The 2008 traffic paper: citation only |
Run the checks on the traffic loop at the top of this page. Its parts pass the first check, since speed and the gap between cars can both be measured, and its arrows carry signs. It marks no delay, so the third check is left open: nothing in the drawing says how long a driver takes to respond.
On the fourth check, the jam has a test on record. But the 2026 paper argues that the waves did not grow the way the simple loop says, so the test supports the jam more than the drawing. On the fifth check, the 2008 paper itself was read here only as a citation.
A note on words: on this site's learning pages, “feedback” means telling a learner whether an answer was right, which is a different thing from the loops here. This site's review of active recall uses the word that way.
For your next practice, take one loop diagram you meet this week, in a textbook or on a slide, and run the five checks on it. Next to each arrow, write whether anyone measured it and where you could read the result. An arrow with nothing written next to it is still a guess.
Data: Which everyday loops on this page were tested
Of the five everyday systems in this ledger, three have a test on record that could be read here in full text or through a full-text report: the ring-road jams, the adjustable governor and the monitored flat. For the bathtub, the papers on record are about people, not the tub: a test of people read as an abstract, and a 2009 paper read as a citation only. For the beer game, a 1989 experiment was read as an abstract that does not use the game's name, and a 2008 study is known here only from a 2020 paper's description. The study-habit loop has no row, because this page cites no source for it.
| Loop | Claim on record | Kind of evidence | Study | Read as |
|---|---|---|---|---|
| Traffic jam on a closed loop of road | A 2008 paper's title reports traffic jams without bottlenecks and experimental evidence for how a jam forms | Experiment | Sugiyama et al. 2008 | Citation only |
| Traffic jam on a closed loop of road | Drivers following each other in single file around a large loop formed backward-moving stop-and-go waves above a critical density | Experiment | Sugiyama et al. 2008 and Tadaki et al. 2013, as reported by Dufour et al. 2026 | Full text of the 2026 report |
| Traffic jam on a closed loop of road | The physical origin of stop-and-go waves is still debated, and in ring experiments the waves appeared after irregular waiting periods rather than growing steadily from one disturbance | Review statement | Dufour et al. 2026 | Full text |
| Traffic jam on a closed loop of road | A 2018 paper's title reports field experiments on the dissipation of stop-and-go waves via control of autonomous vehicles | Experiment | Stern et al. 2018 | Citation only |
| Centrifugal governor on a steam engine | A governor keeps a machine's speed nearly uniform despite changes in driving power or resistance | Engineering description | Maxwell 1868 | Full text |
| Centrifugal governor on a steam engine | Turning up a governor's regulating power past a limit produced an oscillating, jerking motion instead of faster settling | Engineering observation | Maxwell 1868 (reporting Fleeming Jenkin's adjustable governor) | Full text |
| Room thermostat and boiler | With the thermostat in the kitchen, the boiler stopped once the kitchen reached its setpoint and the other rooms stayed about 2 °C cooler during the two-hour morning heating period | Field measurement | Seri et al. 2021 | Full text |
| Room thermostat and boiler | In-depth interviews found people using two theories of how a thermostat works, a feedback theory and a valve theory; the abstract calls the valve theory inconsistent with engineering knowledge | Study of beliefs | Kempton 1986 | Abstract |
| Bathtub: stock and flows | Participants from one elite business school with essentially no prior exposure to system dynamics understood stock and flow relationships and time delays poorly, and performance showed no systematic link to prior education, age or national origin | Test of people | Booth Sweeney and Sterman 2000 | Abstract |
| Bathtub: stock and flows | A 2009 paper's title asks why well-educated adults do not understand accumulation | Paper (methods not read) | Cronin, Gonzalez and Sterman 2009 | Citation only |
| Beer game supply chain | A 2008 study that considered the classic beer game framework studied order amounts in a disrupted supply chain and showed that after a disruption, order variability increased from one stage of the chain to the next | Study (methods not read) | Rong, Shen and Snyder 2008, as described by Doroudi et al. 2020 | Full text of the 2020 report |
| Beer game supply chain | Participants managing a simulated inventory distribution system with several actors, feedback and time delays produced results that departed systematically from optimal behavior, which the abstract attributes to misperceptions of feedback | Experiment | Sterman 1989 | Abstract |
Download the data (CSV, feedback-loops-evidence.csv) · Where each value comes from (JSON) Data: Dufour, O., Nicolas, A., Rodney, D., Cordes, J., Schadschneider, A., & Tordeux, A. (2026). Noise-induced instability of uniform flow in single-file traffic systems. PNAS Nexus 5(4): pgag101, doi:10.1093/pnasnexus/pgag101, CC BY 4.0 (https://creativecommons.org/licenses/by/4.0/); Maxwell, J. C. (1868). On governors. Proceedings of the Royal Society of London 16, 270–283, doi:10.1098/rspl.1867.0055. Public domain (author d. 1879); Seri, F., Arnesano, M., Keane, M. M., & Revel, G. M. (2021). Temperature sensing optimization for home thermostat retrofit. Sensors 21(11): 3685, doi:10.3390/s21113685, CC BY 4.0 (https://creativecommons.org/licenses/by/4.0/); Doroudi, R., et al. (2020). Effects of trust-based decision making in disrupted supply chains. PLOS ONE 15(2): e0224761, doi:10.1371/journal.pone.0224761, CC BY 4.0 (https://creativecommons.org/licenses/by/4.0/); Titles only, from Crossref: Sugiyama et al. 2008; Stern et al. 2018; Cronin, Gonzalez & Sterman 2009; Abstracts deposited in Crossref, paraphrased (publishers' terms apply): Kempton, W. (1986), Cognitive Science 10(1), doi:10.1207/s15516709cog1001_3; Booth Sweeney, L., & Sterman, J. D. (2000), System Dynamics Review 16(4), doi:10.1002/sdr.198; Sterman, J. D. (1989), Management Science 35(3), doi:10.1287/mnsc.35.3.321
Retrieval check
Answer from memory first, then follow the link to the passage and check.
- What did the 2008 ring experiment leave off the road on purpose, and what about its jams is still debated? Back to the passage
- In the bathtub chart, why did the water keep rising after the tap began to slow? Back to the passage
- What does a loop diagram need before it counts as evidence? Back to the passage · A famous loop story, checked against the record
Sources
- Sugiyama, Y., Fukui, M., Kikuchi, M., Hasebe, K., Nakayama, A., Nishinari, K., Tadaki, S., & Yukawa, S. (2008). Traffic jams without bottlenecks—experimental evidence for the physical mechanism of the formation of a jam. New Journal of Physics, 10(3), 033001. doi:10.1088/1367-2630/10/3/033001 https://doi.org/10.1088/1367-2630/10/3/033001
- Dufour, O., Nicolas, A., Rodney, D., Cordes, J., Schadschneider, A., & Tordeux, A. (2026). Noise-induced instability of uniform flow in single-file traffic systems. PNAS Nexus, 5(4), pgag101. doi:10.1093/pnasnexus/pgag101 https://doi.org/10.1093/pnasnexus/pgag101
- Tadaki, S., et al. (2013). Phase transition in traffic jam experiment on a circuit. New Journal of Physics, 15, 103034. As reported by Dufour et al. (2026). https://doi.org/10.1093/pnasnexus/pgag101
- Stern, R. E., Cui, S., Delle Monache, M. L., Bhadani, R., Bunting, M., Churchill, M., Hamilton, N., Haulcy, R., Pohlmann, H., Wu, F., Piccoli, B., Seibold, B., Sprinkle, J., & Work, D. B. (2018). Dissipation of stop-and-go waves via control of autonomous vehicles: Field experiments. Transportation Research Part C: Emerging Technologies, 89, 205–221. doi:10.1016/j.trc.2018.02.005 https://doi.org/10.1016/j.trc.2018.02.005
- Maxwell, J. C. (1868). On governors. Proceedings of the Royal Society of London, 16, 270–283. doi:10.1098/rspl.1867.0055. Quotations from pp. 270, 271 and 272. https://doi.org/10.1098/rspl.1867.0055
- Seri, F., Arnesano, M., Keane, M. M., & Revel, G. M. (2021). Temperature sensing optimization for home thermostat retrofit. Sensors, 21(11), 3685. doi:10.3390/s21113685 https://doi.org/10.3390/s21113685
- Kempton, W. (1986). Two theories of home heat control. Cognitive Science, 10(1), 75–90. doi:10.1207/s15516709cog1001_3 https://doi.org/10.1207/s15516709cog1001_3
- Booth Sweeney, L., & Sterman, J. D. (2000). Bathtub dynamics: Initial results of a systems thinking inventory. System Dynamics Review, 16(4), 249–286. doi:10.1002/sdr.198 https://doi.org/10.1002/sdr.198
- Cronin, M. A., Gonzalez, C., & Sterman, J. D. (2009). Why don't well-educated adults understand accumulation? A challenge to researchers, educators, and citizens. Organizational Behavior and Human Decision Processes, 108(1), 116–130. doi:10.1016/j.obhdp.2008.03.003 https://doi.org/10.1016/j.obhdp.2008.03.003
- Doroudi, R., Sequeira, P., Marsella, S., Ergun, O., Azghandi, R., Kaeli, D., Sun, Y., & Griffin, J. (2020). Effects of trust-based decision making in disrupted supply chains. PLOS ONE, 15(2), e0224761. doi:10.1371/journal.pone.0224761 https://doi.org/10.1371/journal.pone.0224761
- Rong, Y., Shen, Z.-J. M., & Snyder, L. V. (2008). The impact of ordering behavior on order-quantity variability: A study of forward and reverse bullwhip effects. Flexible Services and Manufacturing Journal, 20(1–2), 95–124. doi:10.1007/s10696-009-9054-3. As described by Doroudi et al. (2020). https://doi.org/10.1007/s10696-009-9054-3
- Sterman, J. D. (1989). Modeling managerial behavior: Misperceptions of feedback in a dynamic decision making experiment. Management Science, 35(3), 321–339. doi:10.1287/mnsc.35.3.321 https://doi.org/10.1287/mnsc.35.3.321
- Crossref. Update searches (corrections, retractions, expressions of concern) for doi:10.1088/1367-2630/10/3/033001, doi:10.1093/pnasnexus/pgag101, doi:10.1016/j.trc.2018.02.005, doi:10.1098/rspl.1867.0055, doi:10.3390/s21113685, doi:10.1207/s15516709cog1001_3, doi:10.1016/s0364-0213(86)80009-x, doi:10.1002/sdr.198, doi:10.1016/j.obhdp.2008.03.003, doi:10.1371/journal.pone.0224761, doi:10.1007/s10696-009-9054-3 and doi:10.1287/mnsc.35.3.321. https://api.crossref.org/works?filter=updates:10.1088/1367-2630/10/3/033001
Cite this page
Feedback & Forgetting. (2026-11-06). Feedback Loop Examples: Which Ones Have a Test on Record. https://feedbackandforgetting.com/systems-loops/feedback-loops/ (accessed [date you read it])
No DOI is assigned to this page; cite the address above with the date you read it.
Related reading
-
Systems & Loops
Goodhart’s Law: Cited to a 1975 Paper on Monetary Policy
Picture credit
Illustration: Feedback & Forgetting. Generated schematic illustration — not a photograph or historical record. © Feedback & Forgetting, all rights reserved.
-
Systems & Loops
Cobra Effect: Did People Breed Cobras? No Record Found Yet
Picture credit
"Indian cobra, with 'spectacle' marking on hood. Watercolour" by Wellcome Collection — https://commons.wikimedia.org/wiki/File:Indian_cobra,_with_%27spectacle%27_marking_on_hood._Watercolour_Wellcome_L0019950.jpg — CC BY 4.0 (https://creativecommons.org/licenses/by/4.0/)