Milgram Experiment: Obedience Ranged Widely Across Versions
Study File Feedback & Forgetting Published
Short answer. The Milgram experiment was a set of 23 versions of one procedure, run by Stanley Milgram from August 1961 to May 1962, in which a participant acting as “teacher” gave a learner, played by an actor, what were presented as shocks rising to 450 volts. Across the 21 versions that a 2014 synthesis could compare, the share who went on to 450 volts ranged from 2.5% (1 of 40) to 92.5% (37 of 40), and was 43.6% overall (323 of 740). In the version that paper calls the baseline, 25 of 40 (62.5%) went all the way; 26 of 40 (65%) is the count in three other versions.
In one sentence: Milgram ran 23 versions of his obedience experiment; in the 21 a 2014 synthesis compared, the share who went all the way to 450 volts ranged from 1 in 40 to 37 in 40.
Outline5 sections
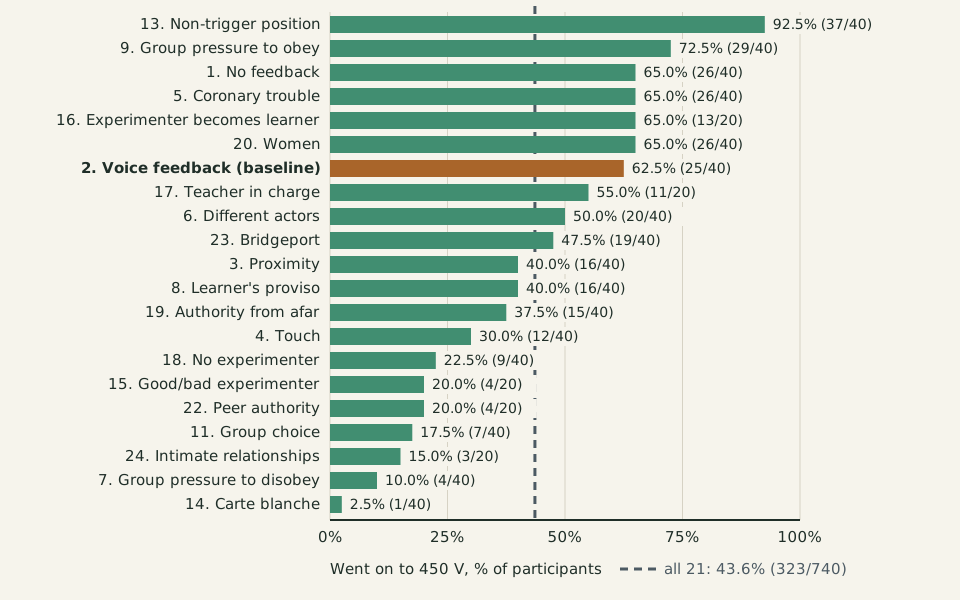
Diagram: Feedback & Forgetting, CC BY 4.0
Copy the credit line
"Share who went on to 450 volts in each of 21 Milgram conditions" by Feedback & Forgetting, https://feedbackandforgetting.com/influence-persuasion/milgram-experiment/, licensed under CC BY 4.0, https://creativecommons.org/licenses/by/4.0/Data: Haslam, N., Loughnan, S., & Perry, G. (2014). Meta-Milgram: An empirical synthesis of the obedience experiments. PLOS ONE 9(4): e93927, doi:10.1371/journal.pone.0093927, CC BY 4.0 (https://creativecommons.org/licenses/by/4.0/), Tables 2 and 3 (counts; percentages recomputed)
Figure 1. Share of participants who went on to the 450-volt shock in each of the 21 conditions compared by Nick Haslam, Steve Loughnan and Gina Perry (2014), highest first, with the number who did so out of the number tested. The dashed line is the rate across all 21.
In one 1960s version of Stanley Milgram's obedience experiment, 37 of 40 men went to 450 volts; in another, 1. In the first, another “teacher” gave the shocks while the man read out the word pairs. In the second, the man chose the shock level himself, and no one told him to raise it. This page asks which number is the result of the Milgram experiment, and how far that result reaches.
The counts come from a 2014 paper in PLOS ONE by Haslam, Loughnan and Perry, titled “Meta-Milgram: An Empirical Synthesis of the Obedience Experiments.” It is open access under a CC BY license and could be read in full, so every condition below is recomputed from its tables.
Study File
- Experiment
- Milgram obedience experiments: 23 versions of one procedure, run at Yale and in Bridgeport
- Researcher and year
- Stanley Milgram; run August 1961 to May 1962; journal paper 1963, book 1974
- Subjects
- 780 participants in 23 conditions of 20 or 40; recruited from the general public; one condition of women, the rest men
- Materials and delays
- A paired-associates word task in which the teacher was directed to give the learner shocks of rising voltage, up to 450 V; one session, no delay
- Design
- Each version changed one or more features of the baseline (learner in an adjoining room who cries out, one experimenter present); in the 21 compared versions the measure was whether the participant went on to the 450 V shock; in two others, obeying meant stopping.
- Main finding
- Going on to 450 V ranged from 1 of 40 (2.5%) to 37 of 40 (92.5%) across 21 comparable versions; 323 of 740 (43.6%) overall; baseline 25 of 40 (62.5%).
- Replication status
- Replication tag: [single study] Rates of going on to 450 V. No full replication to 450 V found in the sources read; a 2006 partial replication stopped at 150 V, and a 2017 study used the same procedure. Scope: adults from the general public, Yale and Bridgeport, 1961–62. Based on full text and abstracts. Checked 2026-11-06.
- Validity
- Crossref lists no correction, retraction or expression of concern for Milgram 1963, Burger 2009, Haslam et al. 2014, Doliński et al. 2017 or Perry et al. 2019 (checked 2026-11-06).
- Meaning for learners, within these conditions
- Within Milgram's 1961–62 procedures, the share who went all the way depended heavily on the setup; no single percentage describes obedience in general.
This card as a spreadsheet (CSV, milgram-experiment-study-file.csv) · Where each value comes from (JSON)
Data: Haslam, N., Loughnan, S., & Perry, G. (2014). Meta-Milgram: An empirical synthesis of the obedience experiments. PLOS ONE 9(4): e93927, doi:10.1371/journal.pone.0093927, CC BY 4.0 (https://creativecommons.org/licenses/by/4.0/); Burger, J. M. (2009). Replicating Milgram: Would people still obey today? American Psychologist 64(1), 1–11, doi:10.1037/a0010932 (abstract; publisher's terms apply); Doliński, D., et al. (2017). Would you deliver an electric shock in 2015? Social Psychological and Personality Science 8(8), 927–933, doi:10.1177/1948550617693060 (abstract; publisher's terms apply)
The baseline condition
Haslam and colleagues number the baseline condition 2. The participant came from the general public and acted as teacher in what was presented as a study of learning word pairs. The learner sat in the next room and cried out as the shocks rose, while one experimenter stayed with the teacher and told him to go on. The measure was whether the teacher went on to the 450-volt shock.
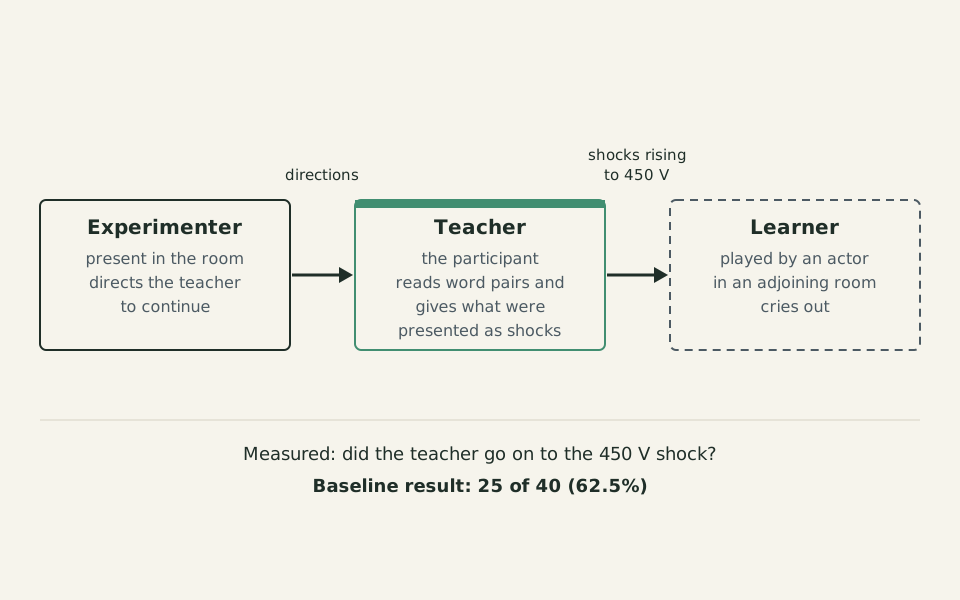
Diagram: Feedback & Forgetting, CC BY 4.0
Copy the credit line
"The three roles in the baseline condition of the Milgram experiment" by Feedback & Forgetting, https://feedbackandforgetting.com/influence-persuasion/milgram-experiment/, licensed under CC BY 4.0, https://creativecommons.org/licenses/by/4.0/Figure 2. The three roles in the baseline condition, as described in Table 1 of Haslam, Loughnan and Perry (2014). Only the teacher was a real participant.
In that version, 25 of 40 men (62.5%) went on to 450 volts. Haslam and colleagues call this the finding of “the best-known version” of the experiment. They add that it “exceeded by a factor of 500” the figure psychiatrists guessed after reading the plan of the study.

Illustration: Feedback & Forgetting. Generated schematic illustration — not a photograph or historical record. © Feedback & Forgetting, all rights reserved.
A lab coat by a doorway, standing for the experimenter's role: in the baseline condition, one experimenter stayed with the teacher and told him to go on. A scene illustration, not a picture of the study.
If you have seen 65% quoted, that is 26 of 40. In the 2014 table, 26 of 40 is the count in three versions: condition 1, where the learner did not cry out; condition 5, where he mentioned heart trouble; and condition 20, the only version with women as teachers.
Milgram's journal paper on the work appeared in 1963 under the title “Behavioral Study of Obedience.” Only its citation record could be read here, with no abstract. So this page does not say which version that paper described.
The other versions
Milgram ran far more than one setup. The 2014 paper lists 23 conditions, numbered in the order they were run. One more number in that list, 21, marks a task in which psychiatrists and laypeople only guessed the outcome. His 1974 book, Obedience to Authority, reported 18 of the 23, by the 2014 paper's count, and nine conditions went unmentioned in all ten textbooks the authors checked.
Two conditions turned the measure around. In one, the experimenter urged the teacher to stop while the learner urged him on; in the other, the two swapped roles. Going to 450 volts meant disobeying there, so the 2014 paper left both out and compared 21 conditions with 740 participants. Most had 40 people; five had 20.
The clearest series moves the learner closer. With the learner in the next room but not crying out, 26 of 40 went on to 450 volts. With him crying out next door, 25 of 40 did; with him in the same room, 16 of 40 (40.0%). When the teacher had to hold the learner's hand to the shock plate, 12 of 40 (30.0%) went all the way.
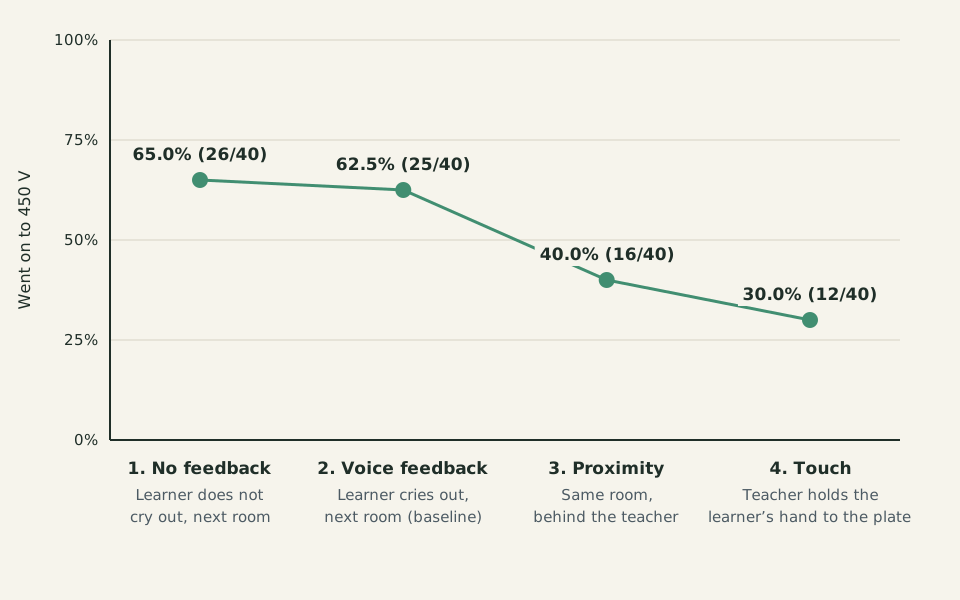
Diagram: Feedback & Forgetting, CC BY 4.0
Copy the credit line
"Closer to the learner, fewer went on to 450 volts: conditions 1 to 4" by Feedback & Forgetting, https://feedbackandforgetting.com/influence-persuasion/milgram-experiment/, licensed under CC BY 4.0, https://creativecommons.org/licenses/by/4.0/Data: Haslam, N., Loughnan, S., & Perry, G. (2014). Meta-Milgram: An empirical synthesis of the obedience experiments. PLOS ONE 9(4): e93927, doi:10.1371/journal.pone.0093927, CC BY 4.0 (https://creativecommons.org/licenses/by/4.0/), Table 2 (counts; percentages recomputed)
Figure 3. Conditions 1 to 4 of the Milgram experiments, which differ in how close teacher and learner were. Each point is one condition of 40 participants.
Other changes moved the rate further. In some versions the participant worked with two other teachers who were secretly confederates. When they refused to go on, 4 of 40 (10.0%) went to 450 volts; when they pressed him to obey, 29 of 40 (72.5%) did.
When the experimenter was called away and left a phone number, 9 of 40 (22.5%) went all the way. When the learner was the teacher's friend or relative, 3 of 20 (15.0%) did. And when the teacher chose the shock level with no direction from the experimenter, 1 of 40 (2.5%) did.
What changed with the setup
Haslam and colleagues coded each condition on 14 features. Among them were whether the experimenter stayed in the room, how close the learner was, and whether peers pushed one way or the other. Then they asked which features went with higher or lower rates across all 740 people, treated as one large sample.
They used logistic regression, a model that links each feature to the odds of going on to 450 volts while holding the others fixed. Eight of the 14 features predicted the outcome in that model. Obedience was lower when no one told the teacher to raise the shocks, when two experimenters disagreed, when peers refused, and when the experimenter left the room. It was also lower when the learner was closer, was a friend or relative, or was shocked by the participant himself rather than by another teacher.
One result ran the other way. In the model, obedience was higher when a peer, not a researcher, took the experimenter's role. The authors write that this “might reflect collinearity,” meaning overlap between features, but that it still contradicts the idea that a more legitimate authority draws more obedience.
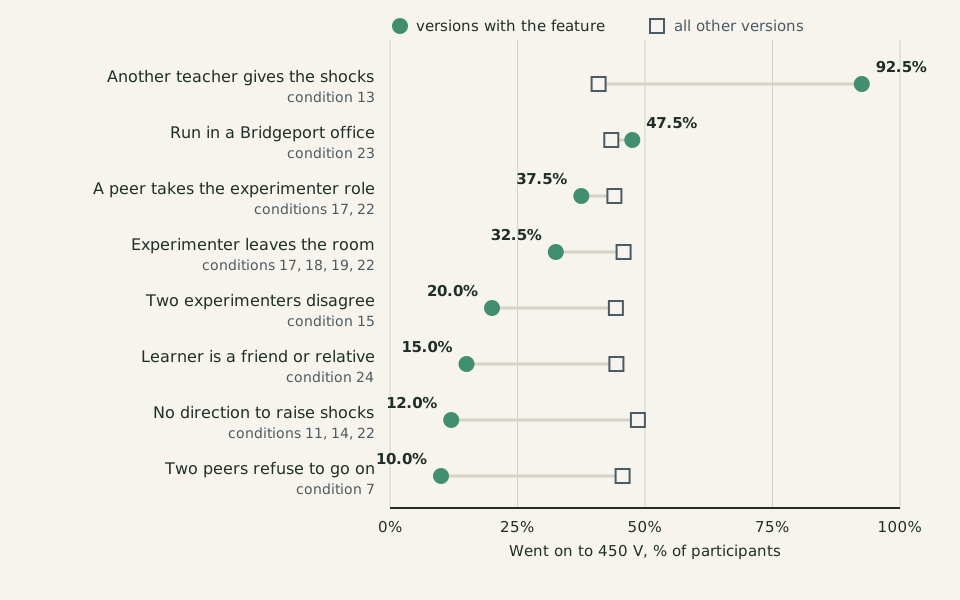
Diagram: Feedback & Forgetting, CC BY 4.0
Copy the credit line
"Share going on to 450 volts with and without each coded feature" by Feedback & Forgetting, https://feedbackandforgetting.com/influence-persuasion/milgram-experiment/, licensed under CC BY 4.0, https://creativecommons.org/licenses/by/4.0/Data: Haslam, N., Loughnan, S., & Perry, G. (2014). Meta-Milgram: An empirical synthesis of the obedience experiments. PLOS ONE 9(4): e93927, doi:10.1371/journal.pone.0093927, CC BY 4.0 (https://creativecommons.org/licenses/by/4.0/), Tables 2 and 3 (counts and codes; rates recomputed)
Figure 4. The share who went on to 450 volts in the conditions with each feature and in all the other compared conditions, recomputed from the condition counts in Haslam, Loughnan and Perry (2014), Tables 2 and 3. These are simple comparisons; the paper's regression holds the other features constant.
The setting showed no clear link here. Milgram reran the study in an office in Bridgeport, away from Yale. There, 19 of 40 (47.5%) went on to 450 volts, against 43.4% in all the other conditions, and the paper found no link with setting. Women went all the way at 65.0% against 42.4% for the rest, but with other features held fixed, gender was not a significant predictor in the model.
These are links across conditions, not separate controlled tests. The authors call Milgram's conditions “a patchwork of methodological elements rather than a systematic investigation.” Each one rests on 40 people or fewer. The paper reports that the model accounted for substantial variation (Nagelkerke R² = 0.30).
Partial replications
The 2014 paper says attempts to replicate the study have had “mixed results.” One it cites is by Jerry Burger, published in 2009 in American Psychologist. According to its abstract, 70 adults took part in a version of what Burger calls Milgram's Experiment 5. No session went past 150 volts, the point at which the learner first protested aloud.
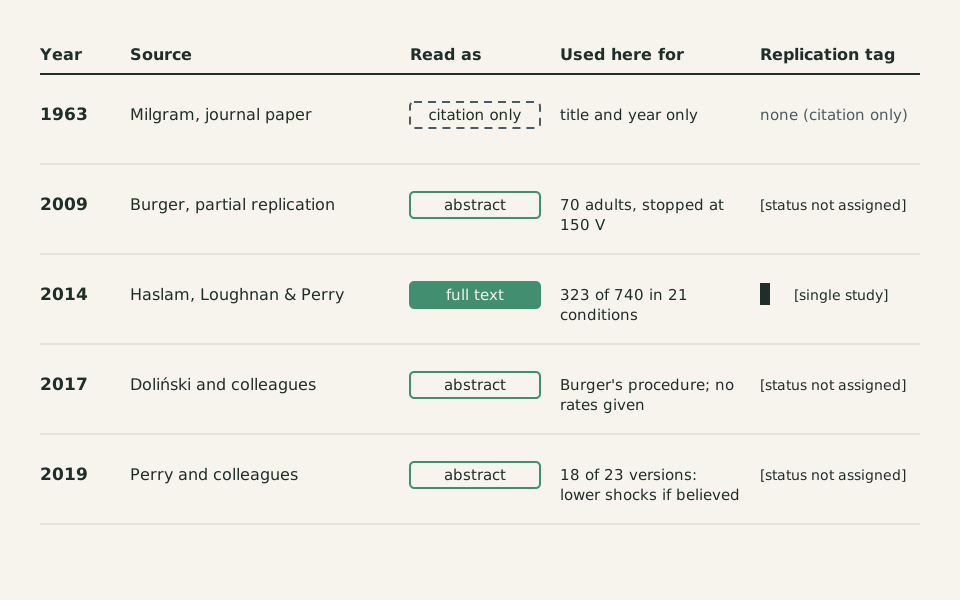
Diagram: Feedback & Forgetting, CC BY 4.0
Copy the credit line
"Milgram experiment evidence ledger, 1963 to 2019" by Feedback & Forgetting, https://feedbackandforgetting.com/influence-persuasion/milgram-experiment/, licensed under CC BY 4.0, https://creativecommons.org/licenses/by/4.0/Figure 5. The sources on the Milgram experiment read for this page, with how much of each could be read and the replication tag each supports. Numbering of Burger's Experiment 5 follows his abstract and is not matched here to the 2014 condition numbers.
The abstract gives the reason for stopping there. As Burger reports it, 79% of Milgram's participants who went past that point kept going to the end. So, the abstract argues, the 2006 results allow fair estimates of what people would have done next. It says obedience rates in 2006 were only slightly lower than Milgram's, but it gives no rates or intervals, so this page cannot judge how close the match was.
[status not assigned] Obedience up to 150 volts in a 2006 partial replication versus Milgram's results. Adults, one session. The abstract reports no rates or confidence intervals. Based on the abstract. Checked 2026-11-06.
A 2017 paper by Dariusz Doliński and colleagues is titled “Would You Deliver an Electric Shock in 2015? Obedience in the Experimental Paradigm Developed by Stanley Milgram in the 50 Years Following the Original Studies.” Its abstract says ethical limits rule out a full replication, so the team used the procedure Burger had proposed and also varied the sex of the participant and of the learner. It reports obedience about as high as in Milgram's original studies and calls the results on sex and personality inconclusive. Like Burger's abstract, it gives no rates, so this page cannot judge the match.
[status not assigned] Obedience in a later study that used Burger's procedure versus Milgram's results. The abstract does not describe the participants beyond their sex and reports no rates or confidence intervals. Based on the abstract. Checked 2026-11-06.
None of the sources read for this page reports a completed rerun that went all the way to the top of the scale. The full rates rest on Milgram's own program.
Replication tag: [single study] Rates of going on to the 450-volt shock across Milgram's conditions. Adults from the general public, Yale and Bridgeport, 1961–62. No full replication to 450 volts read; the 2009 study stopped at 150 volts and the 2017 study used Burger's procedure. Based on full text and abstracts. Checked 2026-11-06.
Peers who refuse
Burger's study also tested peers. By the abstract, people who saw a confederate refuse obeyed as often as those who saw no one refuse. In Milgram's condition 7, two refusing peers cut the rate to 4 of 40. The designs differ: the 2006 study stopped at 150 volts, and its abstract describes one confederate refusing rather than two.
Replication tag: [single study] Two refusing peers lower obedience: 4 of 40 went on to 450 volts in Milgram's condition 7. Men from the general public, one session, 1961–62. The only later test read does not match the design (one refusing confederate, stopped at 150 volts); its abstract reports no drop. Based on full text and the abstract. Checked 2026-11-06.
This site's foot-in-the-door review follows another 1960s compliance study through its later tests, and the persuasion classics table sets the Milgram experiment beside other classic compliance and conformity studies with the same tags.
What the record can't settle
The table counts what people did. It does not show what they thought was happening. Haslam and colleagues name this as a limit of their analysis, citing “apparent skepticism about the experimental set up among many participants.” They add that Milgram's own notes suggest some conditions were hard for participants to take seriously.
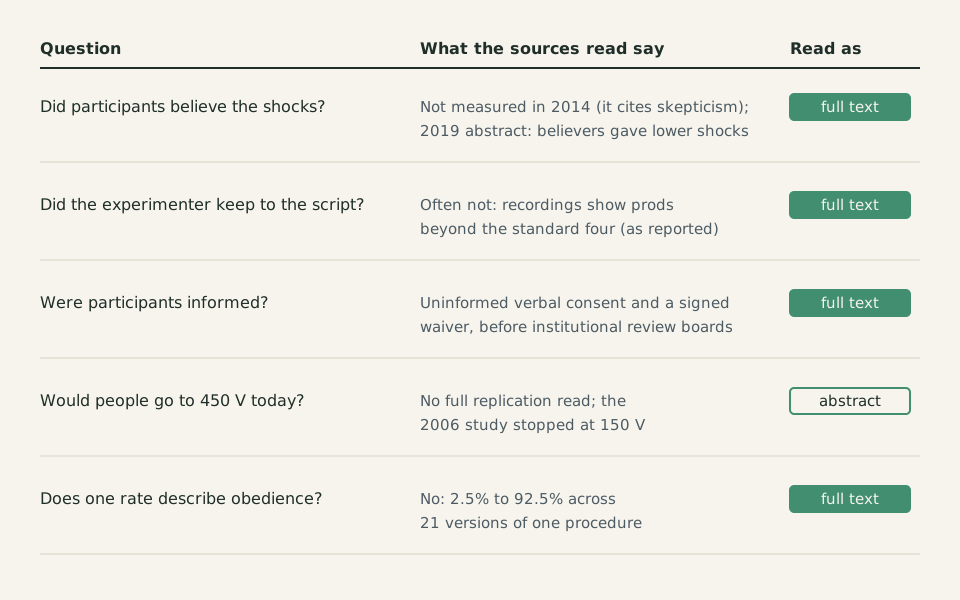
Diagram: Feedback & Forgetting, CC BY 4.0
Copy the credit line
"What the Milgram record can and cannot settle" by Feedback & Forgetting, https://feedbackandforgetting.com/influence-persuasion/milgram-experiment/, licensed under CC BY 4.0, https://creativecommons.org/licenses/by/4.0/Figure 6. What the sources read for this page can and cannot settle about the Milgram experiment, with the reading level behind each answer. The same content is in the table below.
| Question | What the sources read say | Read as |
|---|---|---|
| Did participants believe the shocks were real? | Not measured in the 2014 synthesis, which cites skepticism among many participants; by a 2019 abstract, those who fully believed gave lower shocks in 18 of 23 versions | full text (2014); abstract (2019) |
| Did the experimenter keep to the script? | Often not: tape recordings show prods beyond the standard four, as reported in 2014 | full text |
| Were participants informed? | Uninformed verbal consent and a signed waiver, before institutional review boards | full text |
| Would people go to 450 volts today? | No full replication read; the 2006 study stopped at 150 volts | abstract |
| Does one rate describe obedience? | No: 2.5% to 92.5% across 21 versions of one procedure | full text |
A 2019 paper by Gina Perry (one of the 2014 authors) and colleagues is titled “Credibility and Incredulity in Milgram's Obedience Experiments: A Reanalysis of an Unpublished Test.” It draws on an unpublished study by Milgram's assistant. According to its abstract, in 18 of the 23 versions, participants who fully believed the learner was getting painful shocks gave lower shocks on average than those who did not fully believe it. The authors read this as a sign that belief in the pain raised defiance and doubt raised obedience, but the abstract gives no test statistics, so this page cannot judge how firm the pattern is.
[status not assigned] Lower average shocks among participants who fully believed the shocks were painful, in 18 of 23 versions. Milgram's 1961–62 participants, archival data from an unpublished study. The abstract reports no test statistics or intervals. Based on the abstract. Checked 2026-11-06.
The script also slipped. Citing earlier work in the archives, the 2014 paper reports that the experimenter “frequently did not adhere to the published details of the study protocol.” Tape recordings show him often going beyond the standard four prods, the set phrases he used to urge the teacher on.
The 2014 paper's ethics statement notes that the sessions ran before institutional review boards came into use. Participants gave “uninformed verbal consent” and signed a waiver for the university. The conditions were not built to answer whether the results describe obedience outside this laboratory, and the 2014 authors leave that question open.
The next time someone tells you to keep going with something you object to, check the features that moved the rates in Milgram's lab. Notice whether the person giving directions is present and consistent, whether anyone near you is refusing, and how directly your own action reaches the person on the other end.
Data: Milgram's conditions as tabulated in 2014
| No. | Condition | Participants (quoted) | Went on to 450 V (quoted) | Share, % (recomputed) |
|---|---|---|---|---|
| 1 | No feedback | 40 | 26 | 65.0 |
| 2 | Voice feedback (baseline) | 40 | 25 | 62.5 |
| 3 | Proximity | 40 | 16 | 40.0 |
| 4 | Touch | 40 | 12 | 30.0 |
| 5 | Coronary trouble | 40 | 26 | 65.0 |
| 6 | Different actors | 40 | 20 | 50.0 |
| 7 | Group pressure to disobey | 40 | 4 | 10.0 |
| 8 | Learner's proviso | 40 | 16 | 40.0 |
| 9 | Group pressure to obey | 40 | 29 | 72.5 |
| 10 | Conflicting instructions | 20 | 20 obeyed by stopping | not compared |
| 11 | Group choice | 40 | 7 | 17.5 |
| 12 | Role reversal | 20 | 20 obeyed by stopping | not compared |
| 13 | Non-trigger position | 40 | 37 | 92.5 |
| 14 | Carte blanche | 40 | 1 | 2.5 |
| 15 | Good/bad experimenter | 20 | 4 | 20.0 |
| 16 | Experimenter becomes learner | 20 | 13 | 65.0 |
| 17 | Teacher in charge | 20 | 11 | 55.0 |
| 18 | No experimenter | 40 | 9 | 22.5 |
| 19 | Authority from afar | 40 | 15 | 37.5 |
| 20 | Women | 40 | 26 | 65.0 |
| 22 | Peer authority | 20 | 4 | 20.0 |
| 23 | Bridgeport | 40 | 19 | 47.5 |
| 24 | Intimate relationships | 20 | 3 | 15.0 |
| All 21 compared | 740 | 323 | 43.6 |
Download the data (CSV, milgram-experiment-conditions.csv) · Where each value comes from (JSON) Data: Haslam, N., Loughnan, S., & Perry, G. (2014). Meta-Milgram: An empirical synthesis of the obedience experiments. PLOS ONE 9(4): e93927, doi:10.1371/journal.pone.0093927, CC BY 4.0 (https://creativecommons.org/licenses/by/4.0/), Tables 1–3; Burger, J. M. (2009). Replicating Milgram: Would people still obey today? American Psychologist 64(1), 1–11, doi:10.1037/a0010932 (abstract; quoted values, publisher's terms apply); Doliński, D., et al. (2017). Would you deliver an electric shock in 2015? Social Psychological and Personality Science 8(8), 927–933, doi:10.1177/1948550617693060 (abstract; no values); Perry, G., Brannigan, A., Wanner, R. A., & Stam, H. (2020; online 2019). Credibility and incredulity in Milgram's obedience experiments. Social Psychology Quarterly 83(1), 88–106, doi:10.1177/0190272519861952 (abstract; quoted values, publisher's terms apply); Milgram (1963), doi:10.1037/h0040525 (citation record only; no values)
How the table was built. Counts are from Tables 2 and 3 of Haslam, Loughnan and Perry (2014), CC BY 4.0; condition 21 was a prediction exercise by psychiatrists and laypeople, not an experiment, so it has no counts. In conditions 10 and 12, obeying meant stopping: the paper counts all 20 in each as obedient, so those cells are not counts of people who went on to 450 volts, and no rate is compared. Recomputing the paper's Table 4 from these counts matches every printed value but one: the row for the learner's proviso (the “rights expression” code) prints as 0.41, while the paper's own count for that condition, 16 of 40, gives 0.40. The tables here use the counts.
Retrieval check
Answer from memory first, then follow the link to the passage and check.
- Which three versions in the 2014 table had 26 of 40 going to 450 volts, and what was the baseline count? Back to the passage
- Which two setups brought the share going to 450 volts down to 10% or lower? Back to the passage
- Why did the 2009 replication stop at 150 volts? Back to the passage · The same tags across persuasion classics
Sources
- Haslam, N., Loughnan, S., & Perry, G. (2014). Meta-Milgram: An empirical synthesis of the obedience experiments. PLOS ONE, 9(4), e93927. doi:10.1371/journal.pone.0093927 https://doi.org/10.1371/journal.pone.0093927
- Milgram, S. (1963). Behavioral study of obedience. The Journal of Abnormal and Social Psychology, 67(4), 371–378. doi:10.1037/h0040525 https://doi.org/10.1037/h0040525
- Burger, J. M. (2009). Replicating Milgram: Would people still obey today? American Psychologist, 64(1), 1–11. doi:10.1037/a0010932 https://doi.org/10.1037/a0010932
- Doliński, D., Grzyb, T., Folwarczny, M., Grzybała, P., Krzyszycha, K., Martynowska, K., & Trojanowski, J. (2017). Would you deliver an electric shock in 2015? Obedience in the experimental paradigm developed by Stanley Milgram in the 50 years following the original studies. Social Psychological and Personality Science, 8(8), 927–933. doi:10.1177/1948550617693060 https://doi.org/10.1177/1948550617693060
- Perry, G., Brannigan, A., Wanner, R. A., & Stam, H. (2020). Credibility and incredulity in Milgram's obedience experiments: A reanalysis of an unpublished test. Social Psychology Quarterly, 83(1), 88–106. doi:10.1177/0190272519861952 (published online 2019) https://doi.org/10.1177/0190272519861952
- Crossref. Work records and update searches (corrections, retractions, expressions of concern) for the five DOIs cited on this page. https://api.crossref.org/works?filter=updates:10.1371/journal.pone.0093927
Cite this page
Feedback & Forgetting. (2026-11-06). Milgram Experiment: Obedience Ranged Widely Across Versions. https://feedbackandforgetting.com/influence-persuasion/milgram-experiment/ (accessed [date you read it])
No DOI is assigned to this page; cite the address above with the date you read it.
Related reading
-
Influence & Persuasion
Foot-in-the-Door Technique: Later Tests Gave Mixed Results
Picture credit
Illustration: Feedback & Forgetting. Generated schematic illustration — not a photograph or historical record. © Feedback & Forgetting, all rights reserved.
-

Influence & Persuasion
Door-in-the-Face and 5 Other Classic Studies: Which Held Up?
Picture credit
Illustration: Feedback & Forgetting. Generated schematic illustration — not a photograph or historical record. © Feedback & Forgetting, all rights reserved.